
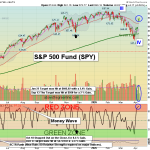
Apr 10, 2026 The Markets were mixed today on lower Buying Volume. Many are hoping that the Markets have bottomed after a major FEAR Flush. But short term, the SPY is quickly back up in the Red Zone (probably too late to buy). Maybe a Market dip down … [Read more...]
Money Wave Alert! Apr 10, 2026
Money Wave Alert! Apr 9, 2026
Apr 9, 2026 The Markets up more today on lower Buying Volume. Many are hoping that the Markets have bottomed after a major FEAR Flush. But short term, the SPY is quickly back up in the Red Zone (probably too late to buy). Maybe a Market dip down some … [Read more...]
Money Wave Alert! Apr 8, 2026
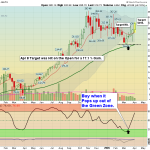
Apr 8, 2026 The Markets Gapped Up today on panic Buying after Crude Oil prices dropped 16 %. The Markets need lower Oil to keep the Economy from slowing down. Maybe a Market dip down some in the next day or 2 fill the Gap and accumulate some strong … [Read more...]
Money Wave Alert! Apr 7, 2026
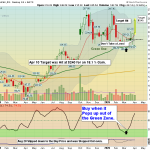
Apr 7, 2026 Today, Markets opened on a weak note, with large caps like SPY moving lower at the open but managing to hold their levels through the session. Despite this stability, there remains an underlying potential for another downside leg in SPY … [Read more...]
Money Wave Alert! Apr 6, 2026
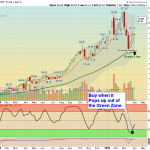
Top Pick of the Week: Figs Inc. $FIGS was bought on the Open today, and will be Sold on the Close on Friday. Apr 6, 2026 Today, markets opened on a mixed note, with large caps like SPY slowly grinding higher toward the bananas line (the fair … [Read more...]
- 1
- 2
- 3
- …
- 492
- Next Page »