Watch List and Charts to Buy Soon.
| Daily Swing Watch List to Buy | Daily Swing Charts to Buy |
| Current Daily Swing Positions | Current Swing Charts |
| Closed Daily Swing Results | Trading Dashboard |
Current Pick and Chart
| Top Pick of the Week | TPOW Stock Chart |
Apr 8, 2026 The Markets Gapped Up today on panic Buying after Crude Oil prices dropped 16 %. The Markets need lower Oil to keep the Economy from slowing down. Maybe a Market dip down some in the next day or 2 fill the Gap and accumulate some strong Stocks.
The USO Oil Fund dumped down 12 % as war Fears subsided, along with massive Short Covering (profit taking from a down side trade).
Wait for more Buy Signals coming up out of the Green Zones. WATCH LIST CHARTS
The best moves happen when the S&P 500 Index is also coming up out of the Green Zone.
______________________________________________________________________________
BUYS TODAY 04/08/2026
HAL Halliburton Co. Swing Trade Buy on the Close, but the Volume is not High (2 Star trade).
LXU LSB Industries Swing Trade Buy on the Close, but the Volume is not High (2 Star trade).
BUYS SOON
| Open Date | Symbol | Description | SCTR | Last Price | Daily Change % | Comments | ATGL 60 Min | id | Strategy | Position | Sell Date | Sell Price | Purchase Price | Net Profit | Realized Gain/Loss % | ATGL Rule | Industry | Size | Stop Loss | color | Chart | Update Date | Status | Unrealized Gain/Loss % | Volume | Post Type | # Shares | Amount Invested | Portfolio Weight | Dividend Rate | Current Yield | Current Value | Yield on Cost | Projected Annual Dividends | Total Dividends Received | Pay Back | Profit / Loss | Annualized Profit/Loss | Star Rating | Target Price | News Alert % | Target Triggered |
|---|---|---|---|---|---|---|---|---|---|---|---|---|---|---|---|---|---|---|---|---|---|---|---|---|---|---|---|---|---|---|---|---|---|---|---|---|---|---|---|---|---|---|
| 2026-07-10 | CLOV | Clover Health | 94 | $4.44 | -5.1282 | Wait for next Daily Money Wave Close > 20 with High Volume. | 5124 | Short Term | Long | $0.00 | 0.00% | HealthCare | Small | https://stockcharts.com/sc3/ui/?s=CLOV&a=1766885665&p=D&yr=0&mn=4&dy=0&id=p31687006556 | 2026-07-10 15:45:37 | open | 0.00% | 6010321 | Watch List | $0 | 0.00% | 0.00 | 0 | $0 | 0.00% | $0 | $0 | 0.00% | 0.00% | - | $5.30 | |||||||||||
| 2026-07-10 | MRNA | Moderna Inc. | 98 | $68.27 | -10.8281 | Money Wave Must Close in the Green Zone. | 5125 | Short Term | Long | $0.00 | 0.00% | HealthCare | Mid | https://stockcharts.com/sc3/ui/?s=MRNA&a=2173993901&p=D&yr=0&mn=4&dy=0&id=p88520548034 | 2026-07-10 16:03:06 | open | 0.00% | 9202370 | Watch List | $0 | 0.00% | 0.00 | 0 | $0 | 0.00% | $0 | $0 | 0.00% | 0.00% | - | $78.00 | |||||||||||
| 2026-07-10 | FCEL | FuelCell Energy | 98 | $21.03 | -8.5652 | Wait for next Daily Money Wave Close > 20 with High Volume. | 5126 | Short Term | Long | $0.00 | 0.00% | Energy | Small | https://stockcharts.com/sc3/ui/?s=FCEL&a=2283130700&p=D&yr=0&mn=4&dy=0&id=p42915098372 | 2026-07-10 16:24:39 | open | 0.00% | 12394004 | Watch List | $0 | 0.00% | 0.00 | 0 | $0 | 0.00% | $0 | $0 | 0.00% | 0.00% | - | $28.00 |
Shop for a better price earlier in the day with Green Candle Buy Signal, on the same day that a Daily Money Wave Buy Signal will occur.
Many like to Buy the Swing Trades just before the Close, if the Money Wave is going to create a Buy Signal (Closing > 20 and up out of the Green Zone). Don’t Buy if the Security has already popped up too much. Money Wave Buy Signals are usually good for a 3-6 % move in a few days.
DAILY SWING SELLS TODAY
AXTI Amer. Xtal Tech Slipped down to the Buy Price and stopped out even.
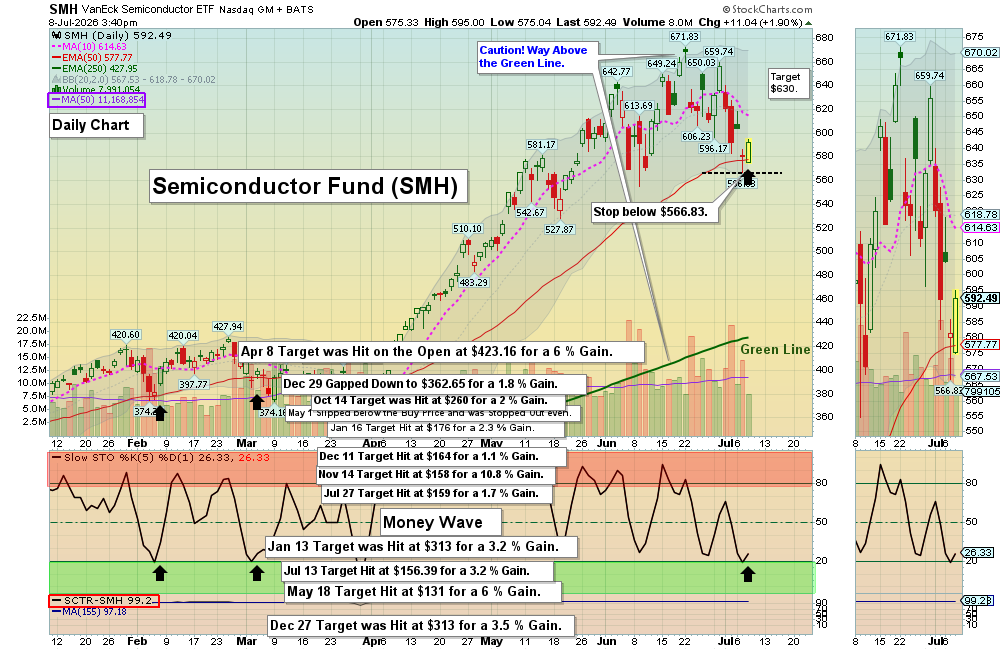
SMH Semiconductor Fund Target was Hit on the Open at $423.16 for a 6 % Gain.
________________________________________________________________________
WEEKLY SWING TRADE POPS
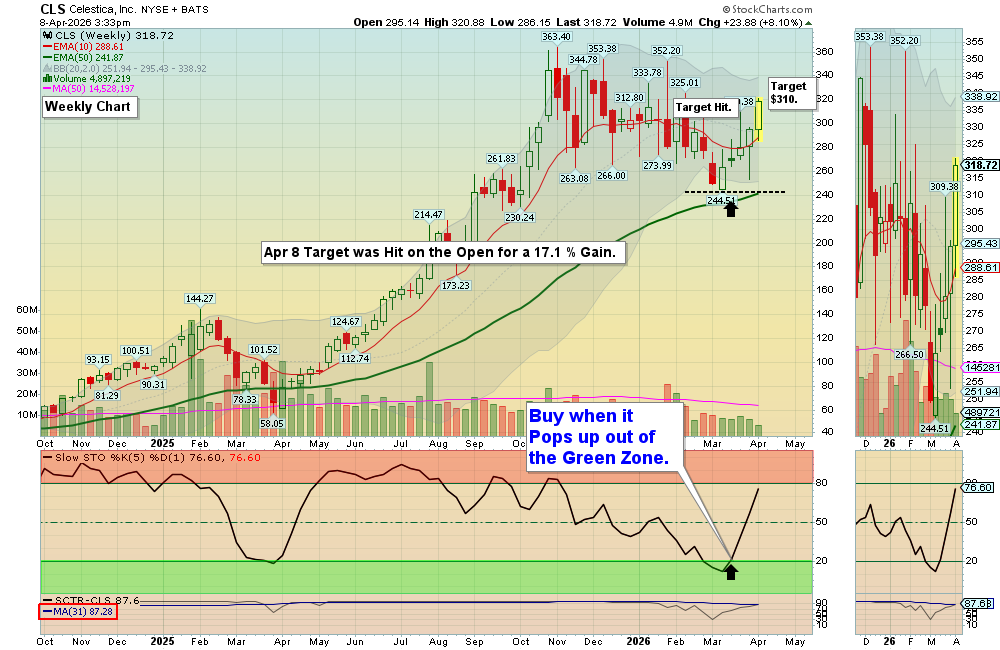
CLS Celestica Inc. Target was Hit on the Open for a 17.1 % Gain.
WEEKLY SWING TRADING (Formerly LONG TERM)Watch List and Charts to Buy Soon.
| Weekly Swing Watch List to Buy | Weekly Swing Charts to Buy |
| Current Weekly Positions | Current Weekly Charts |
| Closed Weekly Swing Trades | Stage Chart Investing |
DAY TRADING SETUPS. Today we had 35 scalp trades for nice Gains at our Trading Room. In this Emotional Market now, Day Trading Alerts are not being sent out on our Discord Site with Live Chatting. Please install Discord app on your PC or cell for mobile notifications. Check out our Live Stream.
Or look for Green Candle Buy Pops (Red Candle turns Green). Big Movers today: AXTI +22% AAOI +12% & SOXL +20%.
Bonds were up today and are Above the Green Line.
Crude Oil was up $16.40 today at $96.39.
TOP PICK OF THE WEEK
MY TRADING DASHBOARD
SWING TRADING CURRENT POSITIONS
DAY TRADING SETUPS
TRADE ALERTS
STAGE CHART INVESTING
TOP 100 STOCKS
PREVIOUS GREEN LINE STOCKS