By ATGL
Updated February 2, 2026
What Is the Bid Ask Spread? How It Impacts Every Trade You Place
In the global financial landscape, every transaction is governed by a fundamental mechanism of price discovery. For investors and traders, the most immediate manifestation of this mechanism is the bid-ask spread. While novice market participants often focus solely on the “last price” or the headline ticker value of a security, professionals understand that the true cost of an investment is dictated by the discrepancy between what buyers are willing to pay and what sellers are willing to accept.
The bid-ask spread is a critical component of stock trading costs that directly influences the net profitability of any given strategy. Whether you are managing a long-term retirement account or executing high-frequency intraday trades, the spread acts as a constant friction. This article provides a comprehensive examination of the bid-ask spread, the economic forces that drive its fluctuations, and the methods traders use to optimize their execution in various market conditions.
What is the Bid Ask Spread?
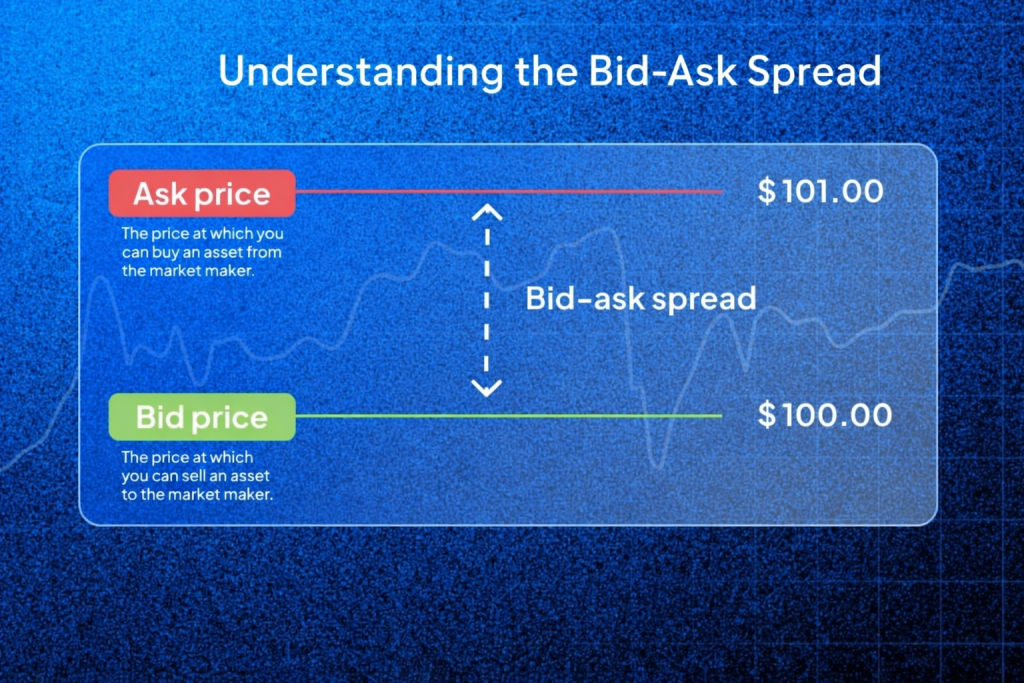
The bid-ask spread is the numerical difference between the highest price a buyer is willing to pay for an asset and the lowest price a seller is willing to accept. It represents the cost of immediate execution in the marketplace. To understand the spread in practice, it is necessary to define the core terminology used in order books across all asset classes.
Definition and Core Concept
At any given moment, a security has two primary prices rather than one:
- Bid Price: This is the maximum price that a buyer (or a collection of buyers) is currently offering to pay for a security. If you own a stock and wish to sell it immediately, the bid price is the amount you will receive per share.
- Ask Price: Also known as the “offer price,” this is the minimum price a seller is willing to accept. If you wish to purchase a stock immediately, the ask price is the amount you must pay per share.
The mathematical calculation is simple: Spread = Ask Price – Bid Price. For example, if a stock is quoted with a bid of $50.00 and an ask of $50.10, the spread is $0.10. While ten cents may seem insignificant, it represents a 0.2% immediate cost to the trader. If that trader buys at $50.10 and sells at $50.00 without any change in the underlying market value, they have realized an immediate loss.
Who Sets the Bid and Ask Prices?
Contrary to common misconceptions, bid and ask prices are not arbitrarily assigned by a central authority or a single brokerage. Instead, they are the result of continuous, real-time competition between various market participants:
- Market Makers: These are professional firms or individuals who provide market liquidity by standing ready to buy and sell at all times. They profit by capturing the spread as compensation for the risk of holding the asset.
- Institutional Investors: Pension funds, mutual funds, and hedge funds often place large limit orders that populate the order book, influencing where the “best” bid and ask prices sit.
- Retail Traders: Individual investors contribute to the spread whenever they place limit orders. If the current bid is $10.00 and you place a limit order to buy at $10.01, you have narrowed the spread and established a new “best bid.”
Why the Bid Ask Spread Exists
The spread is not a “hidden fee” in the traditional sense, but rather a functional necessity of a free-market system. It exists to provide a financial incentive for intermediaries to facilitate trades when a direct buyer and seller are not perfectly matched in time or price.
Role of Market Makers and Liquidity Providers
The primary function of the spread is to compensate market makers for the service of providing liquidity. Liquidity refers to the ease with which an asset can be converted into cash without affecting its price. In a perfectly liquid market, you could sell a large position instantly at the current market price.
However, markets are rarely perfectly balanced. Market makers bridge the gap between a seller who wants to exit now and a buyer who may not arrive for another ten minutes. The spread is effectively the “convenience fee” for this immediate service.
How Spreads Compensate for Risk
Providing liquidity involves taking on significant risk:
- Inventory Risk: When a market maker buys shares from a seller, they must hold those shares until a buyer appears. If the price drops during that holding period, the market maker loses money.
- Adverse Selection Risk: Market makers often trade against “informed” participants who may have better data. To stay in business, they must charge a spread wide enough to cover losses incurred when trading against more informed parties.
What Affects the Size of the Spread
The bid-ask spread is highly dynamic, expanding and contracting based on real-time data and the specific asset class being traded.
Liquidity and Trading Volume
The most influential factor in spread width is trading volume. High-volume assets typically have spreads of only one cent because the massive influx of orders creates intense competition among liquidity providers.
In contrast, “thinly traded” assets often have wide spreads. Because it is harder for a market maker to “offload” their inventory, they widen the spread to account for the increased liquidity risk.
Variance Across Asset Classes
The typical spread varies significantly depending on the nature of the market. The following table highlights these differences:
| Asset Class | Typical Spread Size | Liquidity Level | Primary Drivers |
|---|---|---|---|
| Major Forex Pairs (e.g., EUR/USD) | Extremely Tight (0.0001 – 0.0002) | Very High | 24-hour global volume. |
| Large-Cap Stocks (e.g., AAPL) | Tight ($0.01 – $0.05) | High | Massive retail and institutional interest. |
| Broad Market ETFs (e.g., SPY) | Minimal ($0.01) | Very High | Arbitrage mechanisms and heavy volume. |
| Small-Cap Stocks | Wide ($0.05 – $0.50+) | Low | Lack of market makers and low volume. |
| Corporate Bonds | Very Wide (Variable) | Low | OTC trading and lack of transparency. |
Volatility and Time of Day
Volatility measures the speed of price changes. During an earnings announcement or major economic event, market makers widen the spread to protect themselves from rapid price “gaps.” Additionally, spreads are generally wider at the market open (9:30 AM EST) and narrowest during peak trading hours when participation is highest.
How the Spread Impacts Trade Execution
The bid-ask spread is a “frictional” cost that directly reduces the net return on every investment. While commissions are often explicit, the spread is a hidden cost that requires careful monitoring.
Hidden Costs of Entering and Exiting Positions
Every time a trader enters a position via a market order, they start at a slight “loss” equivalent to the spread. For active traders, such as those focusing on swing trade performance, these small percentages can compound. Over hundreds of trades per year, a difference of a few cents in the spread can mean the difference between a profitable year and a losing one.
Wider Spreads in Low-Volume or Fast-Moving Markets
In fast-moving markets, the “quoted” spread may not even be the “executed” spread. If a trader places a large market order in a low-volume stock, they may eat through the available liquidity at the best ask price and be filled at progressively higher prices. This highlights the danger of using market orders in environments where the bid-ask spread is wide or the order book is “thin.”
Bid Ask Spread vs. Slippage and Commission
To manage total transaction costs, one must distinguish the bid-ask spread from other execution metrics.
- Commission: A flat fee charged by the broker.
- Bid-Ask Spread: The internal market cost determined by liquidity.
- Slippage: The difference between the expected price and the actual executed price, often caused by wide spreads or lack of volume.
Short-term trading strategies, such as scalping, are particularly sensitive to these costs. If a scalper aims for a $0.05 profit but the spread is $0.03, over 60% of the potential gain is consumed by the spread before the trade even moves in their favor.
Tips to Minimize Spread-Related Costs
Reducing the impact of the bid-ask spread is a hallmark of professional trading. By utilizing specific order execution strategies, traders can keep more of their capital working for them.
Using Limit Orders Instead of Market Orders
The most effective way to avoid paying the spread is to use limit orders. A market order guarantees execution but not price, often forcing you to pay the ask. A limit order allows you to specify the maximum price you are willing to pay. By placing a limit order at the “midpoint” (the average of the bid and ask), you may be filled by another trader looking to exit, effectively avoiding the cost of the spread entirely.
Trading During Peak Volume Hours
Liquidity is highest when the most participants are active. For U.S. equities, this is typically between 10:00 AM and 3:30 PM EST. Avoiding the “unsettled” price action of the first and last 30 minutes of the trading day can help ensure you are trading when spreads are at their tightest.
Utilizing Expert Tools and Guidance
Navigating the complexities of market execution requires both the right tools and a disciplined approach to risk management. Understanding the bid-ask spread is only the first step in optimizing your trading performance. For investors looking to refine their strategies and access professional-grade market insights, joining a community of like-minded traders can provide a significant advantage.
To improve your trading consistency and better understand market dynamics, explore the resources and community available at Above the Green Line Memberships.
Conclusion
The bid-ask spread is an unavoidable reality of the financial markets. It serves as the primary indicator of an asset’s liquidity and the inherent risk of its trade execution. By prioritizing liquid assets, utilizing limit orders, and timing trades for peak hours, you can significantly reduce your transaction costs and improve your long-term returns.

Related Articles
Reinvestment Strategy: Turning Income into Compounding Wealth

How the Elder Impulse System Helps Traders Time Their Entries

Kelly Criterion Trading: How to Size Positions with Confidence
SMA vs EMA: Which Moving Average Works Best for Your Trading Strategy?