
By Andrew Stowers
Updated August 6, 2026
By the time an index falls 20% and the press declares a bear market, the average investor has already absorbed most of the drawdown. The threshold is a receipt for damage already done, not a warning. That explains why the standard advice — stay calm, stay invested, dollar-cost average — feels so unsatisfying to anyone watching their account decline: it is built around a label that arrives late and carries no decision rule. A serious approach starts at the trend break, not the headline, and our stock trading guide treats that distinction as the foundation of risk control. This article covers what the 20% rule measures, how long bear markets last, what causes them, and which investments hold up. It then gives a five-step playbook with specific stop levels — and states where that playbook fails.
What Is a Bear Market? The 20% Rule and What It Actually Measures
| Quick Answer
A bear market is a decline of 20% or more in a major stock index from its most recent high, sustained over at least two months. The 20% figure is a classification threshold, not a trading trigger — it confirms a downtrend that has already been underway for weeks or months. |
The Threshold Is a Label, Not a Signal
The 20% rule is descriptive, not predictive. In 2020 the S&P 500 peaked on February 19, crossed the 20% threshold on March 12, and bottomed on March 23 — eleven trading days later. An investor who acted on the official bear market declaration sold within a hair of the low. The label told you where the market had been. It said nothing about where it was going next.
This matters because the threshold is an index measurement, not a portfolio measurement. When the S&P 500 falls 20%, high-beta and small-cap names routinely fall 40 to 60%. A concentrated growth portfolio can be down half its value while the headline still reads “correction.” Your drawdown, not the index’s, determines whether your position sizing was correct.
Cyclical Bears Versus Secular Bears
Not every bear market is the same animal. A cyclical bear runs weeks to months inside a longer-term uptrend — 2018 and 2020 are examples. A secular bear spans years and involves structural repricing of an entire asset class, as in 1973-74 and 2000-2002. The distinction drives sizing: cyclical bears reward patience, secular bears punish it. Our bull vs. bear market comparison covers how the two phases alternate across a full cycle.
How Long Bear Markets Actually Last (And Why the Average Misleads)
| Data Note
All duration, decline, and recovery figures in this article are historical averages compiled from S&P 500 index history. Figures vary meaningfully by dataset, index, and start date. Verify against a current source before relying on them for position sizing. |
The Numbers Everyone Quotes
The average bear market lasts about 289 days — roughly 9.6 months — measured peak to trough across S&P 500 history since 1928. Narrow the window to 1980 through 2024 and the average is 282 days, against 1,018 days for the average bull market. Widen it differently and you get another number: the 13 bear markets between 1946 and 2022 averaged about 14 months. All three figures are defensible. None of them is a forecast.
Why the Average Describes Almost No Actual Bear Market
The distribution is not clustered around the mean. It is bimodal and extremely wide. The 2020 bear market lasted 33 calendar days from peak to trough. The 1973-74 bear market lasted 630. Those two events are roughly 19 times apart in duration, and an average sitting between them describes neither one. Quoting 9.6 months to someone six weeks into a decline gives false precision about a variable that is genuinely unknowable in advance.
The mechanism behind the spread is the cause. Liquidity shocks resolve fast because the fix is policy — a central bank can restore liquidity in weeks. Valuation and credit unwinds resolve slowly because the fix is earnings and deleveraging, and neither can be legislated. Classify the cause and you get a far better duration estimate than any historical average will give you.
Recovery Time Is the Number That Actually Matters
Duration measures how long the market fell. Recovery measures how long you waited to break even, and it is the longer figure: roughly 603 days on average from trough back to a new high. Strip out the four secular events — 1929, 1937, 1973, and 2000 — and the median recovery compresses to about 14 months. Include them and the mean stretches past four years. Plan against the longer number.
Bear Market vs. Correction vs. Recession vs. Crash
The financial press uses these four terms interchangeably and they do not mean the same thing. Three of them describe prices and one describes the economy. Reacting to a recession headline as though it were a price signal — or to a 10% correction as though it were a bear market — is one of the most common ways investors trade the wrong information.
The Four Terms Side by Side
| Term | Threshold | What it measures | What it means for positioning |
|---|---|---|---|
| Correction | 10% decline from a recent high | Price, moderate | Normal; roughly three in four resolve without becoming bear markets |
| Bear market | 20% decline from a recent high | Price, severe | Reduce satellite risk; leave the passive core untouched |
| Crash | Any large decline compressed into days | Velocity, not depth | Liquidity risk spikes; widen stops or stand aside entirely |
| Recession | Sustained contraction in economic output | The economy, not prices | Lagging confirmation; stocks usually bottom months earlier |
Bear Markets and Recessions Are Not the Same Event
They overlap often enough to be confused and diverge often enough to be dangerous. Stocks entered bear markets in 1966, 1987, and 2022 without an accompanying recession. Meanwhile equities are a leading indicator: the market typically bottoms months before a recession is officially declared over, which means waiting for the economic all-clear guarantees a late re-entry. For the economic side in depth, our guide to investing during a recession covers it separately.
Every Major Bear Market Since 1950: Depth, Duration, and Recovery
The historical record is more useful than the average because it lets you pattern-match a current decline against its closest analog. Since 1945 the S&P 500 has produced 15 bear markets averaging roughly a 32% decline, about 11 months to the bottom, and about 1.7 years to full recovery. The five below span the entire range.
The Historical Record
| Period | Decline | Duration | Time to recovery | Trigger |
|---|---|---|---|---|
| 1973-1974 | About 48% | About 630 days | Years | Oil shock, inflation, stagflation |
| 2000-2002 | About 49% | About 929 days | Roughly 7 years | Dot-com bubble deflation |
| 2007-2009 | About 57% | About 517 days | New high in 2013 | Credit and housing collapse |
| Feb-Mar 2020 | About 33.9% | 33 days | New high by Aug 2020 | Pandemic liquidity shock |
| Jan-Oct 2022 | About 25% | About 282 days | Roughly 2 years | Rate hikes, valuation compression |
| Verify Before Use
These figures are approximate and compiled from S&P 500 index history. Exact percentages and dates differ by data provider depending on whether closing or intraday prices are used, and on how overlapping declines are grouped. Confirm against a current source before acting on them. |
Why Deeper Bears Take Disproportionately Longer
Recovery time does not scale linearly with depth, because the math of losses does not. A 20% decline needs a 25% gain to break even. A 50% decline needs a 100% gain. The 2007-2009 decline of roughly 57% required a gain of about 133% just to return to the prior high, which is why it took until 2013. Every additional 10% of drawdown makes the recovery meaningfully harder, and that is the entire argument for capping drawdown rather than riding it out.
Bear markets have occurred roughly every six years over the past 150 years. That frequency makes them a planning assumption rather than a surprise. If your allocation only works in the four years out of five that do not contain one, it does not work.
What Causes Bear Markets — and Why the Cause Predicts the Duration
Every article lists the same causes: inflation, rising rates, geopolitical shocks, bursting bubbles. The list is accurate and close to useless on its own. What matters is that the cause category predicts roughly how long the decline will run, because different causes have different repair mechanisms and those mechanisms operate on different clocks.
Fast Bears: Liquidity and Policy Shocks
An exogenous shock — a pandemic, a sudden geopolitical event, a funding freeze — produces violent, broad, correlated selling. Everything falls together because investors are raising cash, not repricing fundamentals. These resolve fastest because the fix is policy, and liquidity can be restored by a central bank in weeks. The 2020 bear market fell 33.9% in 33 days and printed a new all-time high inside six months of the low.
Slow Bears: Credit, Valuation, and Structural Repricing
Tightening-driven bears such as 2022 compress valuation multiples rather than destroy earnings, and they end when the rate path turns — roughly nine months in that instance. Credit unwinds such as 2007-2009 are the deepest and slowest, because the repair requires actual deleveraging across the banking system and no policy statement accelerates it. Bubble deflations such as 2000-2002 are their own category: the index fell about 49%, but the leadership cohort fell more than 80% and the recovery was led by entirely different companies.
The Rules-Based Bear Market Playbook
| Before You Use These Rules
These are mechanical rules, not predictions. Backtest them against your own instruments and timeframe before committing capital. No rule set avoids all losses — these are designed to cap drawdown, not eliminate it. This article is educational and is not individualized investment advice. |
Here is what no page-one search result will give you: a trigger, a size, and a stop. The five rules below are the framework stated at the level of specificity a trader can actually execute.
The Five Rules
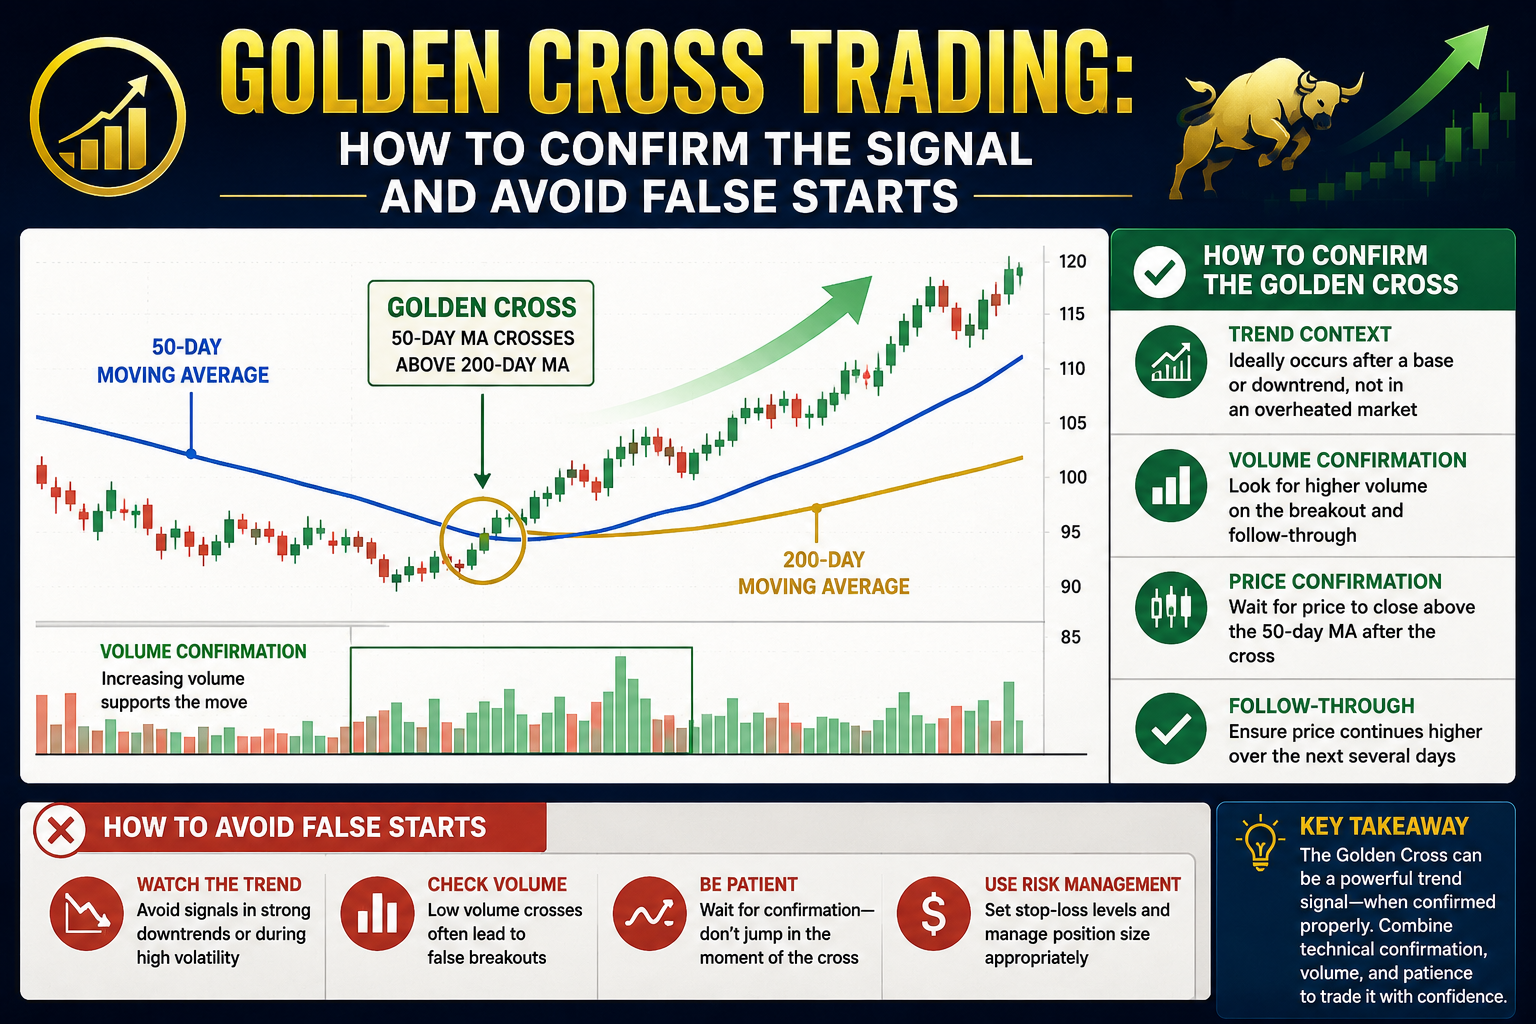
Step 1: De-risk on the trend break, not the 20% label. When the index closes below its rising long-term moving average — the 200-day is the standard reference — and that average itself rolls over from rising to flat or declining, reduce satellite exposure. Two conditions, both required. Price below the average on its own whipsaws constantly; the slope change is what filters noise.
Step 2: Cut size before you cut positions. Halve your position sizing at the first trigger rather than liquidating. A false signal then costs opportunity instead of capital, and you retain exposure if the break fails. Decide in advance the maximum portfolio drawdown you will tolerate — 15% is a common ceiling for an active satellite — and write it down before the decline, because you will not choose it rationally during one. Our explainer on what drawdown actually measures covers why peak-to-trough is the only version that counts.
Step 3: Treat cash as a position with a written re-entry trigger. Cash with no re-entry rule is not risk management; it is paralysis with a good story attached. When you raise cash, record the specific condition that will put it back to work. If you cannot write that condition down in one sentence, do not raise the cash.
Step 4: Trade counter-trend rallies with the stop below the prior swing low. Enter only when price reclaims a prior swing high on expanding volume. Place the stop immediately below the most recent swing low that preceded that entry — a structural level, never a round percentage picked for convenience. If that swing low sits 6% below your entry, then 6% is your risk, and your position size is whatever makes a 6% loss acceptable. Never move the stop to fit the size you wanted.
Step 5: Re-enter only on a confirmed higher low. Price must make a low above the prior low, then trade above the high between them, with the long-term moving average flattening rather than still declining. That is three conditions, and they will always confirm after the exact bottom. That lag is the price of not catching a falling knife.
These Rules Apply to the Satellite, Not the Core
One structural point underpins all five. ATGL’s framework pairs a passive, low-cost ETF core that is never traded during a bear market with a rules-based active satellite that responds to these signals. The core absorbs the decline by design and recovers with the market. The satellite is where drawdown control is exercised. If you are applying trend rules to your entire portfolio, you are not de-risking — you are market timing with extra steps.
Bear Market Investments: What Actually Holds Up
The honest version of this list includes the failure condition for every item on it, because each of these defensive assets has a specific environment in which it stops working — and that environment is rarely the one investors are anticipating.
- Treasury bonds have historically risen when equities fell, providing the classic portfolio hedge.
- Consumer staples and utilities carry lower beta, so they decline less than the index rather than not at all.
- Dividend growers with payout ratios under roughly 60% keep paying while their share prices fall.
- Gold produces no earnings and no yield, which is precisely why it holds value when both are in doubt.
- Cash equivalents are the only asset class with zero drawdown.
- Inverse ETFs give direct short exposure without a margin account, for short holding periods only.
Where Each One Fails
Treasuries broke in 2022. The negative stock-bond correlation that makes them a hedge depends on the decline being growth-driven; when the cause is rising rates, bonds fall alongside stocks and the hedge inverts at exactly the moment you need it. Utilities carry the same defect — they are rate-sensitive and underperform in tightening-driven declines, which is precisely when many investors rotate into them for safety.
Dividend yield is the most misread signal in a decline. A yield that jumps from 3% to 7% has almost always done so because the price collapsed, and a payout ratio above 80% in a falling market is a warning about the dividend’s survival rather than a bargain. Check the payout ratio and the free-cash-flow coverage before you look at the yield.
Inverse and leveraged ETFs decay. Daily rebalancing means that in a choppy market these funds can lose value even when the underlying index finishes lower over the same period. They are short-horizon hedging instruments measured in days to weeks. Holding one across a multi-month bear market is a mathematically losing proposition regardless of whether your directional call was correct.
| Verify Before Use
Yields, expense ratios, payout ratios, and stock-bond correlations change continuously. Confirm current figures with your own data provider before acting on any category above. |
How Bear Markets End: The Recovery Signal Most Investors Miss
More money is lost in bear markets by re-entering badly than by failing to sell. The textbook definition of the end — a 20% rally off the low — is a historian’s tool, not a trader’s, and treating it as an entry signal guarantees you arrive after the steepest part of the move.
Why the Official Confirmation Arrives Too Late
In 2020 the S&P 500 bottomed on March 23. A 20% rally off that low confirmed within weeks, but by the time the confirmation was widely reported a large portion of the recovery had already happened, and the index reached a new all-time high by August. The rule that tells you a bear market ended is the same rule that guarantees you miss the reversal’s best days. Our guide to what a bull market actually is covers the phase that follows.
Three Signals That Arrive Earlier
Market breadth is the most reliable of the three. When the advance-decline line turns positive while the index is still printing lower lows, more stocks are already rising than the headline suggests, and that divergence has preceded most durable bottoms. Structure is second: a higher low followed by a break above the intervening high is the minimum price-based confirmation. Third is the long-term moving average flattening, which is the slowest signal and filters out the majority of false starts.
Bottoms Are Processes, Not Points
No signal identifies a single low, so stop trying to find one. Scale in across three tranches — one at the first higher low, one at the break above the intervening high, one at the moving-average reclaim. If the first tranche is wrong you have committed a third of your intended size instead of all of it. This is a sizing decision rather than a market call, and it is the only version of buying the dip that survives a real bear market.
When the Playbook Fails: The Whipsaw Problem
Every framework in this article shares one failure environment, and it is not a falling market. Trend rules handle sustained declines well. They lose money in chop, and the loss is quiet enough that most traders misdiagnose it as a flaw in the rules rather than a mismatch with conditions.
The Sideways Tape
When an index oscillates in a 10 to 15% band for months without establishing direction, de-risk signals and re-entry signals fire repeatedly. Each round trip costs the bid-ask spread, slippage on both the exit and the entry, and short-term capital gains treatment on any profitable re-entry inside a year. Six whipsaws in a flat year can cost several percent while the index finishes exactly where it started.
Counter-Trend Rallies Are Built to Fool You
Bear market rallies are violent. Retracements of 15 to 20% inside an ongoing decline are routine, and they are convincing enough to pull traders back in at the worst available prices — the pattern known as a dead cat bounce. This is exactly why Step 5 requires three conditions instead of one, and why the third condition is the slowest of the three.
What You Can Actually Do About It
Three mitigations, none of them a cure. Require a confirmation delay of two to three sessions before acting on any trigger. Cut size by half after two consecutive whipsaw losses. Cap re-entry attempts at three per quarter. Each mitigation makes the system slower, and slower systems give back more of the initial decline before de-risking. That trade-off is structural: any rule fast enough to protect you early will whipsaw, and any rule slow enough to avoid whipsaws will protect you late. You choose which cost to pay. You do not get to avoid both.
The Bottom Line on Bear Markets
The 20% threshold is a description of the past and the trend break is a decision in the present, and confusing the two is why so much bear market damage is self-inflicted. Everything that actually protects capital happens before the label is applied and after the bottom is in — precisely where generic guidance goes silent.
The framework:
- A bear market is a 20% index decline, but the label confirms a downtrend rather than predicting one.
- Average duration is roughly 9.6 months, and that average is close to useless across a range of 33 to 630 days.
- The cause predicts the duration: liquidity shocks resolve in weeks, credit unwinds take years.
- Deeper declines take disproportionately longer to recover, because a 50% loss requires a 100% gain.
- De-risk on the trend break with slope confirmation, never on the 20% headline.
- Every entry gets a stop below the prior swing low, sized so that distance is an acceptable loss.
- Re-entry requires a higher low, a break above the intervening high, and a flattening long-term average.
- The entire framework fails in a range-bound market, and no version of it avoids that cost.
| The Bear Market Framework, Maintained for You
At AboveTheGreenLine.com we give self-directed traders the complete rules-based system for market declines — trend-break signals, position-sizing rules, specific stop placement, and written re-entry conditions maintained across every phase of the cycle. The difference between knowing the framework and running it is having the signals delivered before the headline arrives. Join us Above the Green Line. |
Frequently Asked Questions
How long does a bear market last?
The average bear market lasts about 9.6 months, or 289 days, measured from peak to trough across S&P 500 history. That average hides an enormous range: the 2020 bear market lasted 33 days while the 1973-74 bear market ran 630. Duration tracks the cause rather than the calendar. Liquidity shocks resolve quickly because a central bank can restore liquidity in weeks. Credit and valuation unwinds take far longer, because the repair requires deleveraging and earnings recovery, and neither can be accelerated by policy. Recovery time — trough back to a new high — averages closer to 603 days and is the more useful planning number.
What should you do in a bear market?
Reduce position sizes on the trend break rather than selling everything, keep your passive core allocation intact, and hold cash as a defined position with a written re-entry trigger. The sequence matters: cut size before cutting positions, so a false signal costs opportunity instead of capital. Every action needs a specific trigger and a specific stop level decided before the decline rather than during it, because the decision quality of an investor watching a live drawdown is measurably worse. If you cannot write down the condition that would put your cash back to work, you are not managing risk — you are avoiding a decision.
What is the difference between a bear market and a recession?
A bear market is a 20% decline in stock prices; a recession is a sustained contraction in economic output. One measures prices and the other measures the economy, and they overlap often enough to be confused while diverging often enough to be dangerous. Stocks entered bear markets in 1966, 1987, and 2022 without an accompanying recession. The relationship also runs on a lag: equities are a leading indicator and typically bottom months before a recession is officially declared over. Waiting for the economic all-clear before re-entering therefore guarantees a late entry, usually well after the steepest part of the recovery.
How do you know when a bear market is over?
The textbook answer is a 20% rally off the low, but that confirmation arrives long after the bottom — in 2020 the market had already recovered most of its decline by the time the rule triggered. Three earlier signals are more useful. Market breadth improving, with the advance-decline line turning positive while the index still makes lower lows, is the most reliable divergence. A sequence of higher lows followed by a break above the intervening high is the minimum price-based confirmation. Price reclaiming a flattening long-term moving average is the slowest and the cleanest. Each one is confirmable, and each one can fail.