
Mar 16, 2025.
For busy investors that don’t have time to Swing Trade, we now have a simple Strategy:
Top Pick of the Week. You Buy the “Pick” on Monday morning, and then Sell on Friday’s Close.
This “Pick” is emailed to you with this Weekly Commentary (more details here).
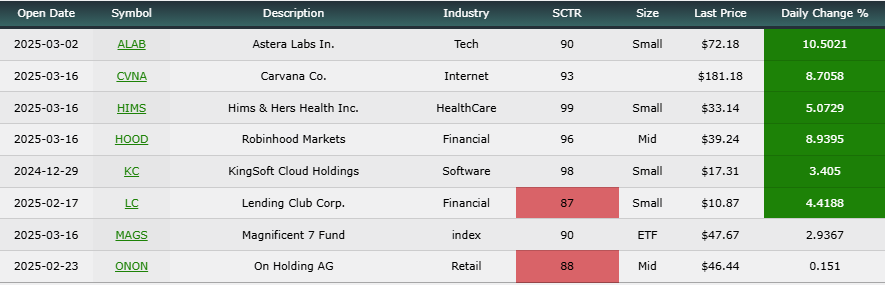
The Top Pick of the Week is: ROBINHOOD MKTS HOOD Buy on the Open on Monday, and Sell on the Close Friday.
Since the Oct 7th TPOW inception, the S&P 500 Fund (SPY) was at 571.30, and is now down -1.5 %.
The 21 Top Picks of the Week Trades are up 26.9 %.
You can view the current Weekly Stock Performance.
______________________________________________________________________________
DAILY SWING TRADING (SHORT TERM)Watchlist and Charts to Buy Soon.
| Daily Swing Watch List | Daily Swing Charts to Buy |
| Current Swing Positions | Current Swing Charts |
| Closed Results | Trading Dashboard |
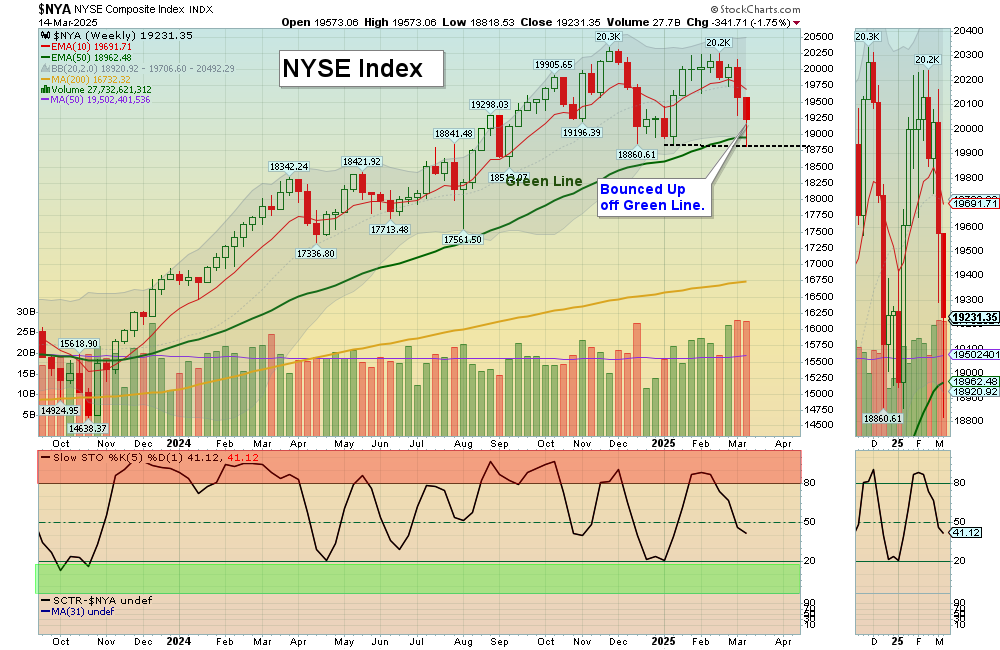
3/16/2025 Markets were lower again for the week, as more profit taking continued on the high momentum Stocks. FEAR was extremely high last week as the S&P 500 and NASDAQ 100 Funds dropped down below the Green Lines (No FEAR Lines). But slowly the FEAR has been dissipating as Human Emotions are temporary. This should be a normal pull-back to take some of the FOMO out of the Markets.
The S&P 500 Chart looks like a Wave 4 Correction down, and then back up again, after this FEAR Flush is over (Emotions are temporary)
We Buy the strongest Leaders that make new highs, on pull-backs. So follow the Green Line System and you should continue to win more than you lose. SEE WATCH LIST
With the Green Line System, your Money should flow into the Strongest areas and your Account value should be able to grow in both Bull and Bear Markets. Follow the MONEY, not the MEDIA.
______________________________________________________________________________
For the week the Dow was down 3.01%, the S&P 500 was down 2.27% and the NASDAQ 100 was down 2.27%. The major Indices still have a Relative Strength below 80, so you should currently own the stronger Funds here.
The Inflation Index (CRB) was down 0.12% the week and is Above the Green Line, indicating Economic Expansion.
Bonds were up 0.07% for the week, and are Above the Green Line, indicating Economic Contraction.
The US DOLLAR was down 0.08% for the week.
Crude Oil was up 0.21% for the week at $67.18 and GOLD was up 2.99% at $3001.10, a new high.
_______________________________________________________________________
DAY TRADERS: We are doing many profitable Day Trades on our Discord Trading Hub (free). Please join Discord or X (Twitter) with your cell phone app for the fastest Trade Alerts and Daily email notifications during the day. Other methods of notification have been too slow. Also, please check our our Live Trading Room on YouTube during Market hours.
_______________________________________________________________________
SWING TRADE COMPLETED TRADES:
TUYA TUYA INC. Stopped Out at $3.85 for a 9.4 % Gain.
We are now in 4 Three Star logged Swing Trading Positions for the Short Term. There are 4 investments on the Short Term Watch List.
Completed Swing Trades in 2025: 53 Trades, + 160.94% Total. Avg. Trade = 3.04 % Gain (before taxes and commissions).
______________________________________________________________________________
LONG TERM WATCH LIST
ATGL Long Term Weekly Watchlist- Click here for scrolling charts.
GBTC GRAYSCALE BIT-COIN FUND Buy Signal at $66.95, Target $80.00.
YPF YPF SOCIEDAD ANONIMA Buy Signal was good for 7.2 Pop and was bought on Friday at $35.78, Target $44.
TSLQ INVERSE TESLA FUND Target was Hit at $65 for a -0.17 % Loss.
Completed Long Term Trades in 2024: 51 Trades, +333.46% Total, or 9.6 % / Trade (before taxes & commissions).
______________________________________________________________________________
Important Links| Top 100 | Stage Chart Investing | CNN Fear & Greed Index |
| Dividend Growth Portfolio | ETF Sector Portfolio | Dogs of the Dow |
| Long Term Strategy | Stage Chart Investing | Articles |
Alert! Market Risk is Medium (YELLOW). The probability of successful Short Term Trades is better, when the % of stocks above the 50-day avg. is below 20.
Tell your Friends about the Green Line, and Help Animals.
______________________________________________________________________________
QUESTION: Peter W. writes “When you say the Relative Strength should be “ABOVE 90 RS “. I look at your chart and it shows SCTR 90, not RSI. Please clarify.
ANSWER: Hi Peter. We don’t use RSI, which is a technical oscillator. We use Relative Strength compared to the Market:
Q: Where do I find the Relative Strength Factor in StockCharts.com so I can add it to my charts?
A: Relative Strength Values comes from the SCTR Rank (StockCharts Technical Rank), www.etfscreen.com for ETFs , and Investor’s Business Daily (IBD) for stocks. We prefer the longer term weighting used by www.etfscreen.com and IBD. We sometimes use a 155-day avg. of StockCharts SCTR, which is at the bottom left of many charts (just below the SCTR Rank) to simulate R S closer to the longer term ranking of IBD ranking.
Good trading, and tell your friends!
ATGL