
Jul 6, 2025.
The 33 Green Line Top Picks of the Week are up +41.5 %, vs the S & P 500 + 9.5 % since Oct inception.
For busy investors that don’t have time to Swing Trade, we now have a simple Strategy:
Top Pick of the Week. You Buy the “Pick” on Monday morning, and then Sell on Friday’s Close. It’s a time-efficient approach designed to capture short-term gains without requiring constant market monitoring.
This “Pick” is emailed to you with this Weekly Commentary (see below & more details here).
The Top Pick of the Week is: Navitas Semiconductor Corp. $NVTS will be bought on the Open on Monday, and will be Sold on the Close this Friday.
You can view the current Weekly Stock Performance.
______________________________________________________________________________
DAILY SWING TRADING (SHORT TERM)Watchlist and Charts to Buy Soon.
| Daily Swing Watch List | Daily Swing Charts to Buy |
| Current Swing Positions | Current Swing Charts |
| Closed Results | Trading Dashboard |
7/6/2025 Markets were higher again for the shortened holiday week, as the S&P 500 and NASDAQ 100 Funds were able to go higher than the February highs. Buying Volume has not been great, and the strongest Stocks are very over-bought from MAX Greed & FOMO (Fear of Missing Out). Now the other Indices must make highs also (DOW 30, Transport, Small Caps) to confirm that this Stock rally is strong.
The S&P 500 will eventually correct back down near the Red Line (50-day avg.) for another Swing Buy, which is normal after a big run up like last week on Good News.
We Buy the strongest Leaders that make new highs, on pull-backs. So follow the Green Line System and you should continue to win more than you lose. SEE WATCH LIST
With the Green Line System, your Money should flow into the Strongest areas and your Account value should be able to grow in both Bull and Bear Markets. Follow the MONEY, not the MEDIA.
______________________________________________________________________________
For the week the Dow was up 2.30%, the S&P 500 was up 1.70% and the NASDAQ 100 was up 1.48%. The major Indices still have a Relative Strength below 80, so you should currently own the stronger Funds here.
The Inflation Index (CRB) was up 0.06% this week and is Above the Green Line, indicating Economic Expansion.
Bonds were down 0.11% for the week, and are Below the Green Line, indicating Economic Expansion.
The US DOLLAR was down 0.42% for the week.
Crude Oil was up 2.00% for the week at $66.83 and GOLD was up 1.77% at $3326.27.
_______________________________________________________________________
DAY TRADERS: We are doing many profitable Day Trades on our Discord Trading Hub (free). Please join Discord or X (Twitter) with your cell phone app for the fastest Trade Alerts and Daily email notifications during the day. Other methods of notification have been too slow. Also, please check our our Live Trading Room on YouTube during Market hours.
_______________________________________________________________________
SWING TRADE COMPLETED TRADES:
AAPS & SOUN Slipped down to the Buy Prices and were Stopped Out even.
We are now in 2 Three Star logged Swing Trading Positions for the Short Term. There are 4 investments on the Short Term Watch List.
Completed Swing Trades thru June 2025: 115 Trades, + 293.7% Total. Avg. Trade = 2.55 % Gain (before taxes and commissions).
______________________________________________________________________________
LONG TERM WATCH LIST
| Open Date | Symbol | Description | Industry | SCTR | Size | Last Price | Daily Change % | ATGL 60 Min | Comments | id | Strategy | Position | Sell Date | Sell Price | Purchase Price | Net Profit | Realized Gain/Loss % | ATGL Rule | Stop Loss | color | Chart | Update Date | Status | Unrealized Gain/Loss % | Volume | Post Type | # Shares | Amount Invested | Portfolio Weight | Dividend Rate | Current Yield | Current Value | Yield on Cost | Projected Annual Dividends | Total Dividends Received | Pay Back | Profit / Loss | Annualized Profit/Loss | Star Rating | Target Price | News Alert % | Target Triggered |
|---|---|---|---|---|---|---|---|---|---|---|---|---|---|---|---|---|---|---|---|---|---|---|---|---|---|---|---|---|---|---|---|---|---|---|---|---|---|---|---|---|---|---|
| 2026-03-22 | GDX | Gold Miners Fund | Metals | 95 | etf | $85.79 | 4.1267 | Wait for next Weekly Money Wave Close > 20 with High Volume. | 5003 | Long Term | Long | $0.00 | 0.00% | https://stockcharts.com/sc3/ui/?s=GDX&a=1832911385&p=W&yr=1&mn=6&dy=0&id=p16449223489 | 2026-03-22 17:05:18 | open | 0.00% | 35300840 | Watch List | $0 | 0.00% | 0.00 | 0 | $0 | 0.00% | $0 | $0 | 0.00% | 0.00% | - | $105.00 | |||||||||||
| 2026-03-21 | CDE | Coeur Mining Inc. | Metals | 94 | Mid | $17.13 | 5.9369 | Wait for next Weekly Money Wave Close > 20 with High Volume. | 5005 | Long Term | Long | $0.00 | 0.00% | https://stockcharts.com/sc3/ui/?s=CDE&a=2121277613&p=W&yr=1&mn=0&dy=0&id=p65338454561 | 2026-03-22 18:08:10 | open | 0.00% | 34419986 | Watch List | $0 | 0.00% | 0.00 | 0 | $0 | 0.00% | $0 | $0 | 0.00% | 0.00% | - | $24.00 | |||||||||||
| 2026-03-18 | UEC | Uranium Energy Corp. | Energy | 89 | Small | $12.92 | -0.9962 | Wait for next Weekly Money Wave Close > 20 with High Volume. | 4993 | Long Term | Long | $0.00 | 0.00% | https://stockcharts.com/sc3/ui/?s=UEC&a=2221261881&p=W&yr=1&mn=6&dy=0&id=p02881329142 | 2026-03-18 18:50:28 | open | 0.00% | 8224576 | Watch List | $0 | 0.00% | 0.00 | 0 | $0 | 0.00% | $0 | $0 | 0.00% | 0.00% | - | $17.50 |
ATGL Long Term Weekly Watchlist- Click here for scrolling charts.
RGTI Rigetti Computing Inc. Weekly Buy Signal was good for a 22 % Pop. Target is $16.50.
Completed Long Term Trades in 2024: 51 Trades, +333.46% Total, or 9.6 % / Trade (before taxes & commissions).
______________________________________________________________________________
Important Links| Top 100 | Stage Chart Investing | CNN Fear & Greed Index |
| Dividend Growth Portfolio | ETF Sector Portfolio | Dogs of the Dow |
| Long Term Strategy | Stage Chart Investing | Articles |
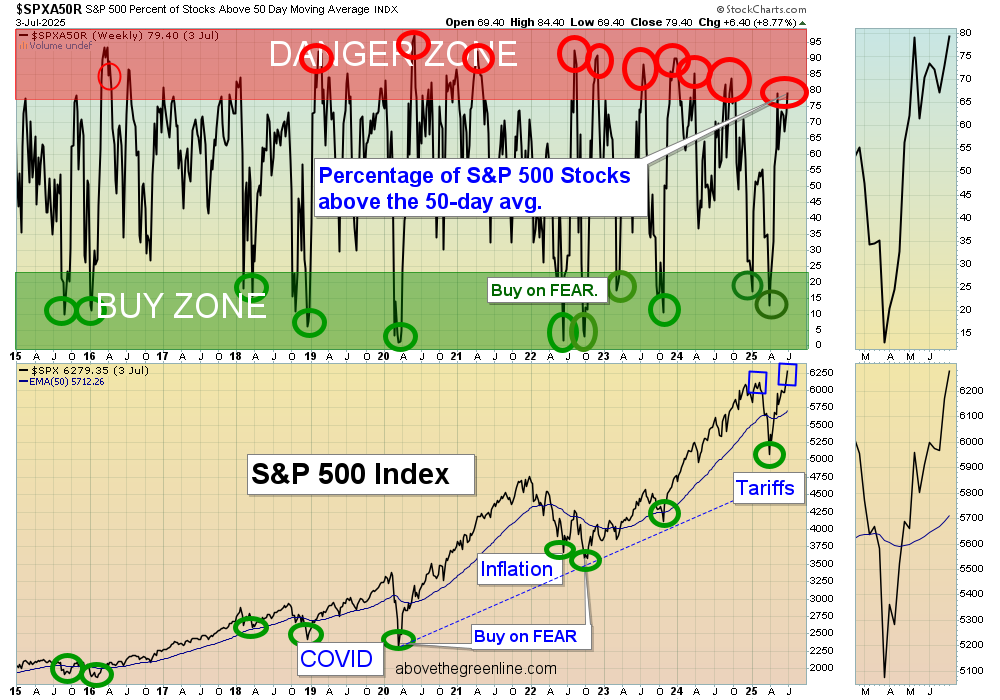
Alert! Market Risk is High (RED). The probability of successful Short Term Trades is better, when the % of stocks above the 50-day avg. is below 20.
Tell your Friends about the Green Line, and Help Animals.
______________________________________________________________________________
QUESTION: Winter writes ““Don’t take a Loss” confuses me. What does that mean?”
ANSWER: When the Investment has a Money Wave Buy Signal, it should pop up 3-6 % in just a few days.
If it is not popping up well, and the Money Wave > 50, either Get Out, or Don’t Take a Loss!
Something must be Wrong. There will be plenty more… Raise Cash, and don’t get Stuck! Wait for the next one.
Good trading and tell your friends!
ATGL