
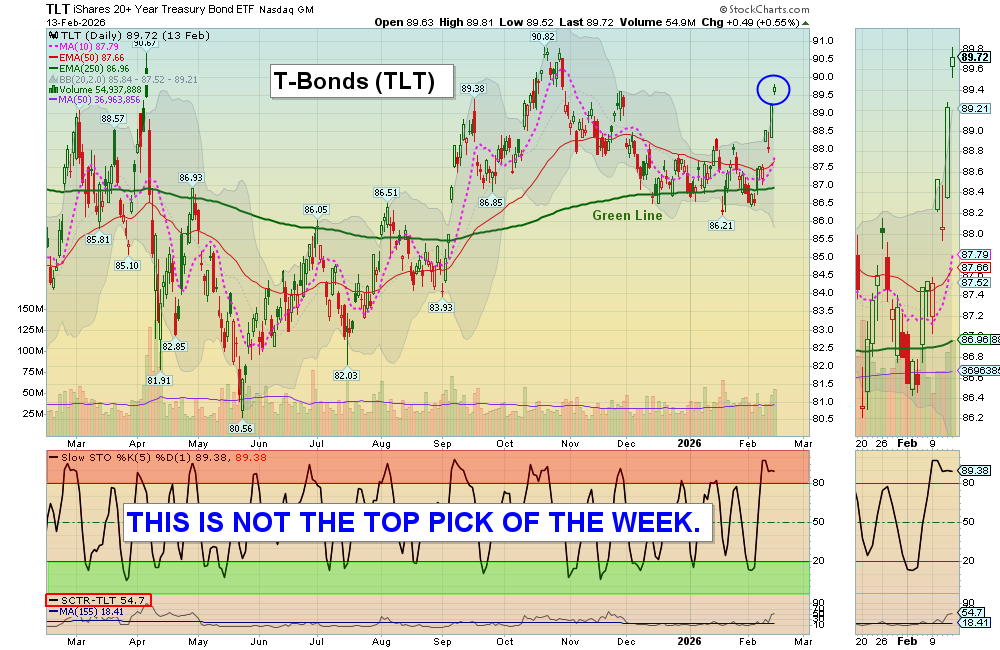
The Top Pick of the Week: $SLV Silver Fund was Sold for a 4 % conservative Gain this week on a Trade Alert.
So far In 2026 the Top Pick Strategy had 6 trades totalling 28%, while the S&P 500 was up 0 %.
For busy investors that don’t have time to Swing Trade, we now have a simple Strategy:
Top Pick of the Week. You Buy the “Pick” on Monday morning, and then Sell on Friday’s Close. It’s a time-efficient approach designed to capture short-term gains without requiring constant market monitoring.
This “Pick” is emailed to you with this Weekly Commentary (see Pick below & more details here).
The Top Pick of the Week is: T1 Energy Inc. $TE to Buy on the Open Tuesday and Sell on the Close Friday.
You can view the superior Weekly Stock Performance.
______________________________________________________________________________
DAILY SWING TRADING (SHORT TERM)Watchlist and Charts to Buy Soon.
| Daily Swing Watch List | Daily Swing Charts to Buy |
| Current Swing Positions | Current Swing Charts |
| Closed Results | Trading Dashboard |
2/16/2026 Markets were lower for the week, as Bit-Coin and many Techs are still way down on MAX FEAR. We are not Selling down here on FEAR. Dumb Money bought on the Highs with borrowed money and is now having to Sell from Margin Calls. We like to Buy on FEAR, and many of the Tech & Momentum Stocks have dropped 30-50 % (probably too late to Sell). Opportunity.
Key Market Drivers: AI “Bubble” Concerns: A “tech selloff” intensified as investors questioned the return on investment for billions spent on AI infrastructure. Concerns that AI might disrupt or replace traditional software services led to a $1 trillion loss in market value for the software sector in a single week.
The “Magnificent Seven” Breakdown: The group of mega-cap tech leaders fell roughly 2% over the week, contributing to a nearly 7% year-to-date decline.Sector Rotation: While tech struggled, investors moved capital into Utilities, Consumer Staples, and Energy, seeking safety in a “firmer economy” and defensive yields.
The major Stocks Indices are struggling up here, as historically most Stocks are very expensive now. If you will need CASH later this year, probably take some profits up here and WAIT for another FEAR Flush by the Magician / Media, used to scare out the Dumb Money who Buys at the TOP (Markets have had a huge rally from the April lows).
We Buy the strongest Leaders that make new highs, on pull-backs. So follow the Green Line System and you should continue to win more than you lose. SEE WATCH LIST
With the Green Line System, your Money should flow into the Strongest areas and your Account value should be able to grow in both Bull and Bear Markets. Follow the MONEY, not the MEDIA.
______________________________________________________________________________
For the week the Dow was down 1.15%, the S&P 500 was down 1.39% and the NASDAQ 100 was down 1.27%. Try to own the stronger Funds here.
The Inflation Index (CRB) was down 0.95 % this week and is Above the Green Line, indicating Economic Expansion.
Bonds were up 2.49% for the week, and are Above the Green Line, indicating Economic Contraction.
The US DOLLAR was up 0.17% for the week.
Crude Oil was down 1.04 % for the week at $62.89 and GOLD was up 1.52% at $5043.92.
_______________________________________________________________________
DAY TRADERS: We are doing many profitable Day Trades at our Live Trading Room on YouTube during Market hours. Please join Discord or X (Twitter) with your cell phone app for the fastest Trade Alerts and Daily email notifications during the day. Other methods of notification have been too slow.
_______________________________________________________________________
COMPLETED DAILY SWING TRADE TRADES:
BATL Battalion Oil Sold via Trade Alert with a 8.77 % Gain.
HL Hecla Mining Stopped out at break even.
GDX Gold Miners Fund Target was Hit at $105 with a 6.4 % Gain.
IBRX Immunity Bio Sold via Trade Alert with a 12 % Gain.
ONDS Ondas Holding Stopped out at break even.
We are now in 1 Three Star logged Swing Trading Positions for the Short Term. There are 2 investments on the Short Term Watch List.
Completed Swing Trades in 2025: 243 Trades, or 3.21% Avg. / Trade (before taxes and commissions). ______________________________________________________________________________
WEEKLY SWING TRADES – WATCH LIST
| Open Date | Symbol | Description | Industry | SCTR | Size | Last Price | Daily Change % | ATGL 60 Min | Comments | id | Strategy | Position | Sell Date | Sell Price | Purchase Price | Net Profit | Realized Gain/Loss % | ATGL Rule | Stop Loss | color | Chart | Update Date | Status | Unrealized Gain/Loss % | Volume | Post Type | # Shares | Amount Invested | Portfolio Weight | Dividend Rate | Current Yield | Current Value | Yield on Cost | Projected Annual Dividends | Total Dividends Received | Pay Back | Profit / Loss | Annualized Profit/Loss | Star Rating | Target Price | News Alert % | Target Triggered |
|---|---|---|---|---|---|---|---|---|---|---|---|---|---|---|---|---|---|---|---|---|---|---|---|---|---|---|---|---|---|---|---|---|---|---|---|---|---|---|---|---|---|---|
| 2026-03-22 | GDX | Gold Miners Fund | Metals | 95 | etf | $96.01 | 4.6202 | Wait for next Weekly Money Wave Close > 20 with High Volume. | 5003 | Long Term | Long | $0.00 | 0.00% | https://stockcharts.com/sc3/ui/?s=GDX&a=1832911385&p=W&yr=1&mn=6&dy=0&id=p16449223489 | 2026-03-22 17:05:18 | open | 0.00% | 42051255 | Watch List | $0 | 0.00% | 0.00 | 0 | $0 | 0.00% | $0 | $0 | 0.00% | 0.00% | - | $105.00 | |||||||||||
| 2026-03-21 | CDE | Coeur Mining Inc. | Metals | 94 | Mid | $19.11 | 1.8114 | Wait for next Weekly Money Wave Close > 20 with High Volume. | 5005 | Long Term | Long | $0.00 | 0.00% | https://stockcharts.com/sc3/ui/?s=CDE&a=2121277613&p=W&yr=1&mn=0&dy=0&id=p65338454561 | 2026-03-22 18:08:10 | open | 0.00% | 35099304 | Watch List | $0 | 0.00% | 0.00 | 0 | $0 | 0.00% | $0 | $0 | 0.00% | 0.00% | - | $24.00 |
Weekly Green Zone Pops – Click here for scrolling charts.
WEEKLY SWING TRADES NONE
Completed Weekly Swing Trades in 2025: 44 Trades, or 16 % / Trade (before taxes & commissions).
______________________________________________________________________________
Important Links| Top 100 | Stage Chart Investing | CNN Fear & Greed Index |
| Dividend Growth Portfolio | ETF Sector Portfolio | Dogs of the Dow |
| Long Term Strategy | Stage Chart Investing | Articles |
Alert! Market Risk is Medium (Yellow). The probability of successful Short Term Trades is better, when the % of stocks above the 50-day avg. is below 20.
Tell your Friends about the Green Line, and Help Animals.
______________________________________________________________________________
QUESTION: Peter W. writes “When you say the RSI should be “ABOVE 90 RS “. I look at your chart and it shows SCTR 90, not RSI. Please clarify.
ANSWER: Hi Peter. We don’t use RSI, which is a technical oscillator. We use Relative Strength compared to the Market:
Q: Where do I find the Relative Strength Factor in StockCharts.com so I can add it to my charts?
A: Relative Strength Values comes from the SCTR Rank (StockCharts Technical Rank), MarketInOut.com, and Investor’s Business Daily (IBD) for stocks. We prefer the longer term weighting used by MarketInOut.com and IBD, but the SCTR is convenient on the charts.
We sometimes use a 155-day avg. of StockCharts SCTR, which is at the bottom left of many charts (just below the SCTR Rank) to simulate R S closer to the longer term ranking of IBD ranking.
Good trading, and tell your friends!
ATGL