By Andrew Stowers
Updated June 15, 2026
Large cap stocks form the foundation of more investment portfolios than any other asset class. They are the companies inside your 401(k)’s S&P 500 index fund, the names filling the watchlists of professional traders, and the holdings that have compounded wealth for patient investors through every market cycle.
Understanding what large cap stocks are, what distinguishes them from smaller companies, and how they behave in different market environments is foundational knowledge for any active investor. More importantly, knowing when to own the index versus when to select individual names is the portfolio decision that separates reactive investors from deliberate ones. After reading this article, we encourage you to check out our Stock Trading Guide for a more in-depth review of all-things stock trading.
What Are Large Cap Stocks? Definition and the Market Cap Spectrum
| Quick Answer
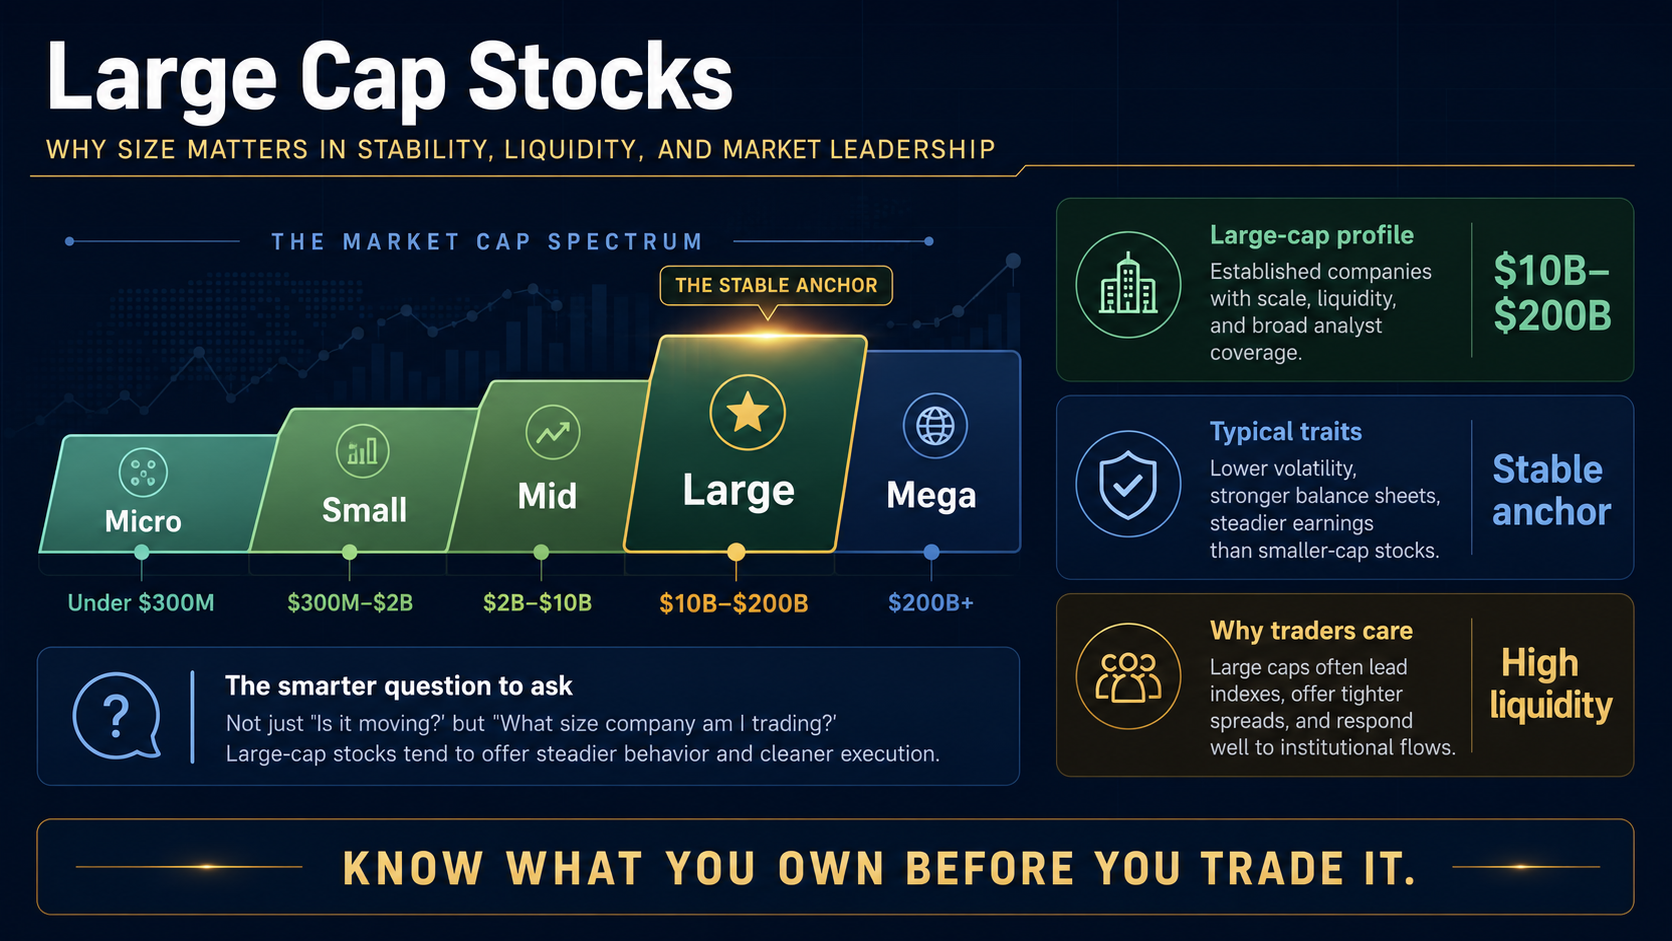
Large cap stocks are shares of companies with a market capitalisation of $10 billion or more — calculated by multiplying share price by total shares outstanding. They form the backbone of major equity indices like the S&P 500 and Russell 1000, are the most widely traded and institutionally owned equity segment, and exhibit lower volatility than mid and small cap stocks. |
Market cap is calculated simply: share price × total shares outstanding. A company trading at $150 per share with 10 billion shares outstanding has a market capitalisation of $1.5 trillion. This number fluctuates with every price change, which is why precise market cap figures for individual companies require real-time verification.
The Full Market Cap Spectrum
| Cap Tier | Market Cap Range | Volatility | Growth Potential | Index Example |
|---|---|---|---|---|
| Mega Cap | $200B+ | Lowest | Slowest | Top 10 S&P 500 names |
| Large Cap | $10B–$200B | Low–Moderate | Moderate | S&P 500, Russell 1000 |
| Mid Cap | $2B–$10B | Moderate | Moderate–High | S&P MidCap 400, Russell Midcap |
| Small Cap | $300M–$2B | High | High | Russell 2000, S&P SmallCap 600 |
| Micro Cap | Under $300M | Highest | Highest (or zero) | Russell Microcap |
Large Cap Examples by Sector
Illustrative large cap companies by sector include: technology (Apple, Microsoft, Alphabet, Meta, Nvidia), financials (JPMorgan Chase, Berkshire Hathaway, Visa, Mastercard), healthcare (Johnson & Johnson, UnitedHealth, Eli Lilly), consumer (Amazon, Walmart, Procter & Gamble), and energy (ExxonMobil, Chevron). These names appear in this category not as investment recommendations but as reference points — market caps change continuously.
Major large cap indices: the S&P 500 is the most widely referenced large cap benchmark, comprising the 500 largest eligible U.S. companies selected by committee. The Russell 1000 covers the 1,000 largest by market cap — mechanically constructed. The Dow Jones Industrial Average is a price-weighted index of 30 large cap companies, more symbolic than representative.
The Characteristics That Define Large Cap Stocks
Market cap alone does not tell the full story. Large cap stocks share a cluster of characteristics that emerge from their size and the dynamics it creates in their markets.
Liquidity and Institutional Ownership
Large cap stocks trade millions of shares daily with tight bid-ask spreads. This liquidity is not incidental — it is created by the concentration of institutional ownership. Pension funds, mutual funds, ETFs, insurance companies, and sovereign wealth funds all hold large cap stocks as core positions. Their continuous trading creates the deep, liquid markets that allow even large orders to be executed efficiently.
This institutional ownership also creates consistent demand support. Price dislocations in large cap stocks are typically smaller and shorter-lived than in smaller companies, because institutional buyers appear when prices are perceived as dislocated.
Analyst Coverage and Information Efficiency
Most large cap stocks are covered by 20-40 or more sell-side analysts. This near-universal coverage means information is rapidly researched and priced in — both a comfort and a challenge. Less scope for an individual investor to hold meaningful information advantage; more confidence that current prices reflect widely available information.
Blue Chip: Overlap and Distinction
Large cap and blue chip are frequently conflated, but the terms define different things. Large cap is defined purely by market capitalisation: a company is large cap if its market cap exceeds $10 billion. Blue chip is a qualitative descriptor referring to companies with long operating histories, strong competitive positions, consistent earnings records, and recognised brand strength. All blue chips are large caps; not all large caps are blue chips. A recently listed technology company with a $50 billion market cap is a large cap; a financially stable company with a century of operating history and consistent dividends is a blue chip.
Dividend Tendency and Lower Growth Rate
Large cap companies are more likely to pay dividends than smaller companies — they have passed the capital-intensive growth phase where all earnings need reinvestment. Many S&P 500 constituents pay regular dividends, and dividend growth is a meaningful consideration for income investors in the large cap universe. The trade-off: large cap companies grow revenues and earnings more slowly than smaller companies. They are too large to double their business easily.
Large Cap vs Mid Cap vs Small Cap: What Changes and Why It Matters
The market cap spectrum is not just a taxonomy — it maps directly onto risk/return trade-offs and market cycle behaviour. Understanding these differences changes how you build a portfolio.
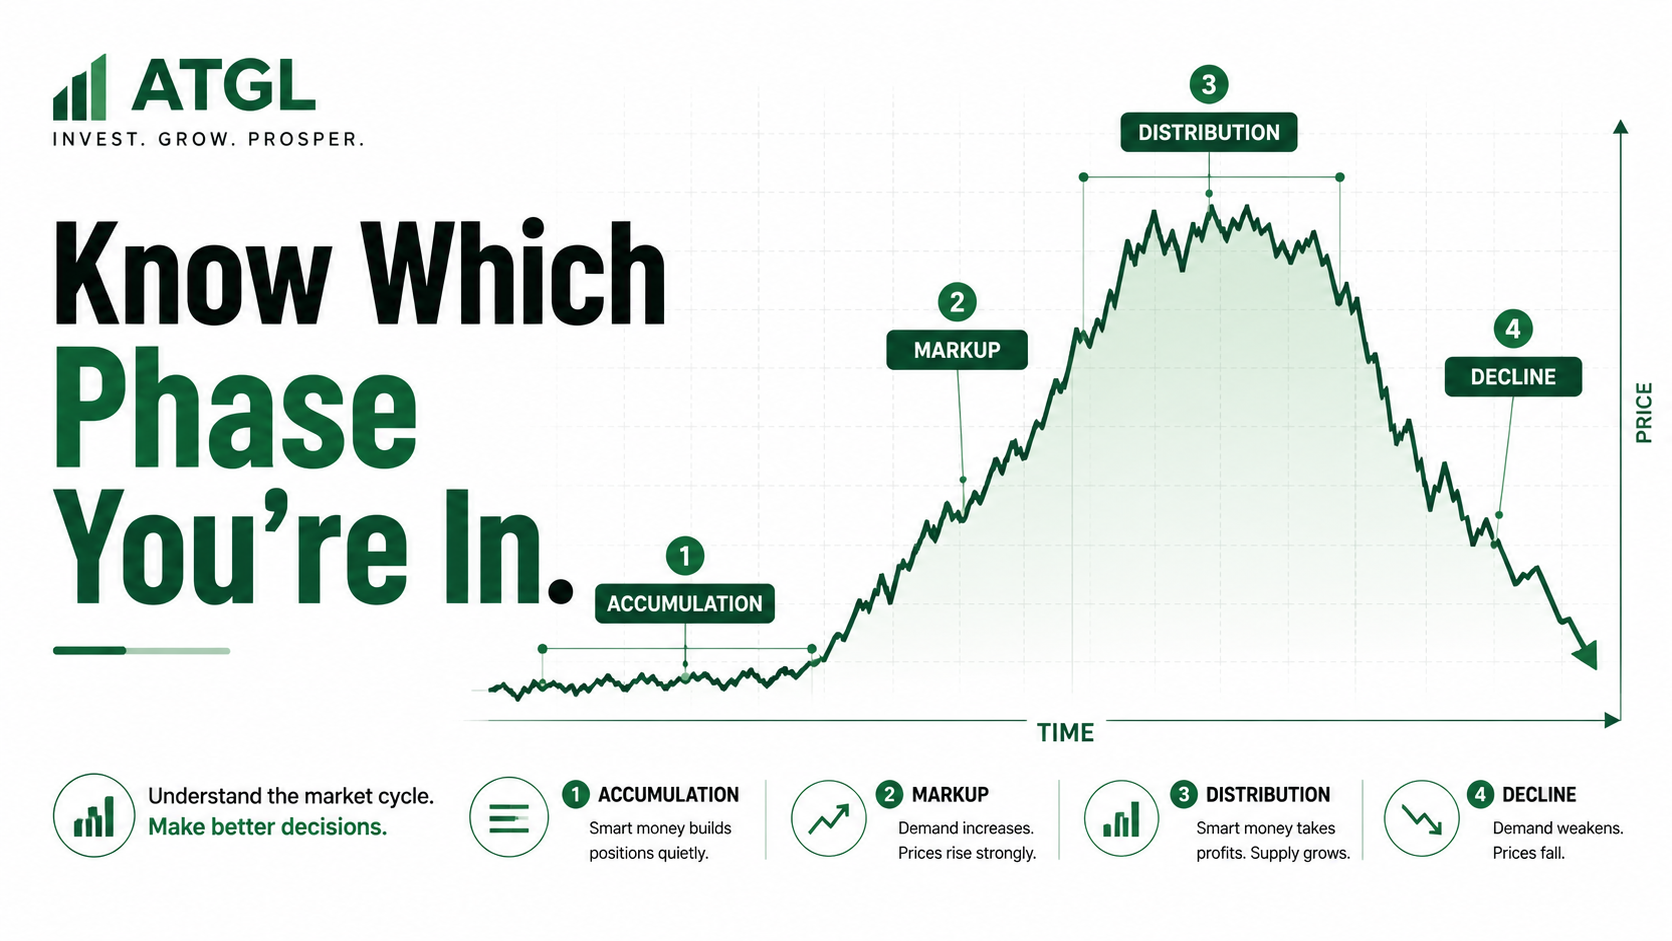
Market Cycle Behaviour
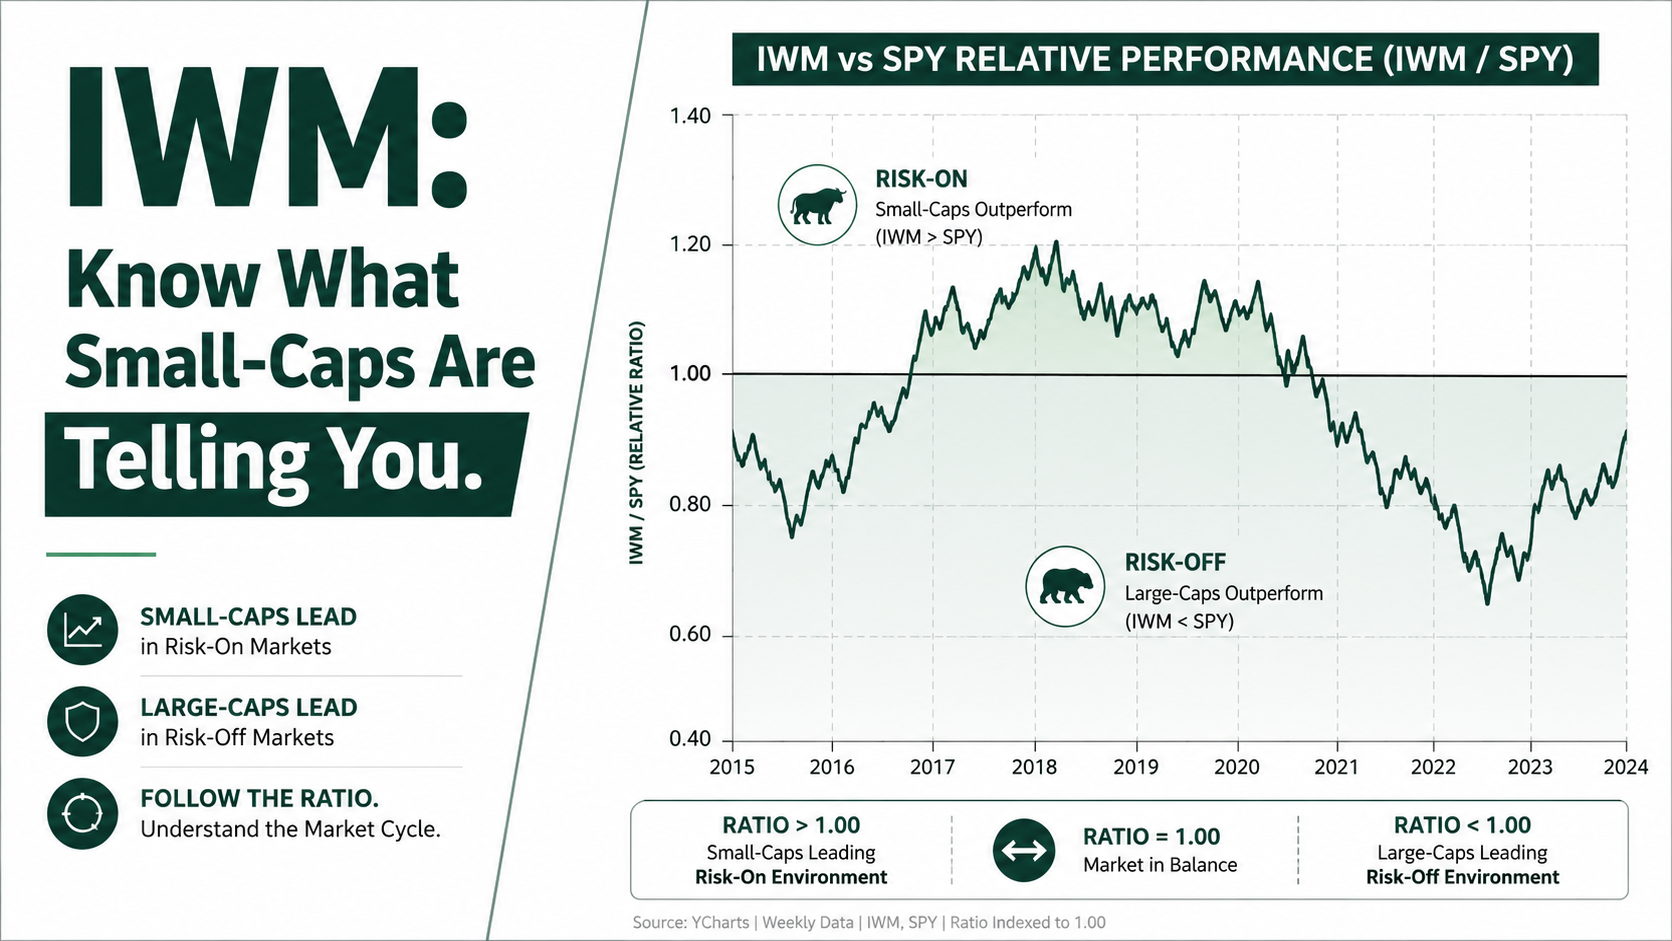
Small and mid cap stocks tend to outperform large caps in the early phase of bull markets — when economic recovery is broadening and risk appetite is high, smaller companies with greater operating leverage capture the most upside. Large cap stocks tend to lead in late-cycle bull markets and hold up better in bear markets — investors rotate to larger, more liquid, more defensively positioned companies as confidence fades.
This cyclical pattern has practical implications: a portfolio heavily tilted toward small caps at the late stage of an economic cycle may underperform a large cap portfolio during the ensuing correction. Awareness of cycle position is a legitimate input to cap tier allocation.
The Size Premium
Academic research — most famously Fama and French — has documented that small cap stocks have historically delivered higher long-run returns than large cap stocks, a finding called the size premium. This excess return compensates for the additional risk: small caps have higher volatility, larger drawdowns, and greater exposure to economic downturns. Whether the size premium will persist is debated; its historical existence is well-documented.
Mid Cap: The Often-Overlooked Tier
Mid cap stocks occupy an interesting position — offering more growth potential than large caps with better liquidity and analyst coverage than small caps. Many active managers treat mid cap as a tactical sweet spot. Standard market-cap weighted indices underweight mid cap relative to large cap, meaning passive investors may be under-allocated to this tier without realising it.
Large Cap ETFs: Building the Passive Core
| Data Note
All ETF expense ratios require verification at fund provider websites before investing. Figures below are approximate. |
For most investors, the primary exposure to large cap stocks comes through passive index ETFs. These instruments track major large cap indices at minimal cost and provide instant diversification across hundreds or thousands of companies.
| Ticker | Issuer | Index Tracked | Approx. ER | Key Characteristic |
|---|---|---|---|---|
| SPY | SPDR | S&P 500 | ~0.095% | Most traded equity ETF; deep options market |
| IVV | iShares | S&P 500 | ~0.03% | Lower cost S&P 500 alternative |
| VOO | Vanguard | S&P 500 | ~0.03% | Lowest cost S&P 500 option |
| VV | Vanguard | CRSP US Large Cap | ~0.04% | Broader than S&P 500 (~800 holdings) |
| IWB | iShares | Russell 1000 | ~0.15% | Top 1,000 U.S. companies by market cap |
| RSP | Invesco | S&P 500 Equal-Weight | ~0.20% | Reduces mega-cap concentration |
The Expense Ratio Compounding Effect
The difference between VOO at ~0.03% and SPY at ~0.095% appears trivial. On $500,000 over 30 years at 7% gross annual return, the 0.065% ER difference compounds to approximately $65,000 in foregone wealth. The passive core’s primary advantage is cost — protecting that advantage by choosing the lowest-cost vehicle for broad large cap exposure is a compounding decision, not just an annual expense.
S&P 500 Sector Concentration
A ‘diversified’ S&P 500 ETF has meaningful sector concentration: technology represents approximately 25-30% of S&P 500 weight. Combined with communication services, the index has a significant growth-tech tilt. Investors who want genuinely balanced large cap exposure should either accept this concentration or use sector ETFs to rebalance — overweighting defensive sectors, underweighting crowded ones.
Large Cap Stocks Across Sectors: Where the Concentration Lives
Passive large cap ETFs distribute exposure very unequally across sectors. Understanding this concentration is essential for any investor who believes they hold a ‘diversified’ large cap portfolio.
- Technology (~25-30% of S&P 500): Apple, Microsoft, Nvidia, Broadcom — the sector that has driven S&P 500 returns disproportionately in recent years; most exposed to valuation compression in rising rate environments
- Financials (~13%): JPMorgan Chase, Berkshire Hathaway, Visa — cyclical exposure to economic growth and interest rate levels; benefits from rising rate environments
- Healthcare (~12%): Johnson & Johnson, UnitedHealth, Eli Lilly — defensive characteristics; tends to hold up in economic slowdowns; regulated industry exposure
- Consumer Discretionary (~11%): Amazon, Tesla — includes massive technology-adjacent companies; highly cyclical
- Defensive sectors (Utilities, Consumer Staples, REITs): combined ~15-20%; the cushion in bear markets; outperforms in late-cycle and recession environments
The practical implication: an investor who holds only an S&P 500 ETF and believes they are neutrally diversified across the economy is actually running a technology-heavy portfolio. Sector ETFs allow deliberate reweighting — overweighting healthcare and utilities in defensive posture, tilting toward financials and energy in early-cycle positioning.
Trading Individual Large Cap Stocks: The Active Satellite
Beyond the passive core, large cap stocks are the primary universe for many active traders — not despite their size, but because of it.
Why Large Caps Work Well for Active Trading
Three structural advantages make large caps better than small caps for most active trading: liquidity (tight bid-ask spreads, large volume, minimal execution cost on entry and exit), technical chart precision (more market participants watching the same levels means technical support and resistance is more reliable), and deep options markets (covered calls, protective puts, and earnings strategies are most accessible on large caps with robust options chains).
The Institutional Moving Average Effect
The 50-day and 200-day moving averages carry disproportionate weight on large cap stocks because institutional investors actively reference them. When a large cap stock reclaims its 200-day moving average after a prolonged decline, institutional buy algorithms trigger. When it breaks below with volume, institutional selling follows. The self-fulfilling nature of these levels makes them more reliable as support and resistance than equivalent levels on thin, small-cap charts.
Earnings as Catalyst Events
Large cap earnings reports are precisely dated, heavily covered, and followed by significant price moves. Active traders use earnings in two deliberate ways: trading the gap open that often follows an earnings surprise (buying into a bullish gap with volume confirmation, fading an overextended bearish gap), or explicitly avoiding overnight earnings exposure by closing positions before the report. Neither approach is random — both require defined rules applied consistently.
Combined Exposure Management
If a large cap stock is already held through a passive index ETF (as it almost certainly is if you own SPY or VOO), an additional active satellite position in the same name creates concentration that must be tracked. Define a maximum combined passive + active allocation to any single large cap name relative to total portfolio.
Large Cap Stocks in Portfolio Construction
Large cap stocks anchor the portfolio allocation decision for most investors. The specific role depends on the investor’s phase and objectives.
The Core Allocation
For most investors, a passive large cap ETF (VOO, IVV, or VV) serves as the largest single holding — the stable, diversified, low-cost compounding engine of the portfolio. This allocation requires minimal active management: periodic rebalancing and systematic contribution. Its primary virtues are reliability and cost efficiency.
The Satellite Allocation
Beyond the core, the satellite holds active positions — individual large cap names selected on fundamental and technical merit, sector ETFs expressing a tactical view, or thematic positions. The satellite is where the active, rules-based approach generates potential return above the passive core. ATGL’s system applies here: specific entry criteria, defined position sizes, explicit stop levels.
Phase-Appropriate Allocation
- Conservative profile (65+, income-focused): 50-60% large cap ETF core, lower volatility, supplement with dividend large caps in satellite
- Moderate profile (45-65, balanced): 50-70% large cap ETF core, satellite includes tactical individual large caps and sector ETFs
- Aggressive profile (under 45, growth-oriented): 40-50% large cap core, remainder in smaller caps, sector ETFs, and active satellite positions
These are illustrative ranges — individual circumstances, risk tolerance, and financial goals require personalised guidance. The consistent element: a low-cost large cap ETF as the portfolio’s compounding foundation.
The Deliberate Large Cap Investor
Large cap stocks are simultaneously the most ordinary part of any portfolio — the index ETF running quietly in the background — and a rich universe of active trading opportunities for investors who know how to use them.
The framework:
- Know the market cap spectrum — large cap sits between stability and growth; what you sacrifice in return potential you recover in liquidity, coverage, and resilience
- Understand blue chip vs large cap — quality and size are related but not identical criteria
- Use passive large cap ETFs (VOO, IVV) as the portfolio core — lowest cost, maximum diversification, reliable compounding
- Recognise sector concentration in S&P 500 ETFs — ‘diversified’ large cap exposure has a technology tilt
- Apply the 50-day and 200-day MAs as primary technical reference levels for active large cap positions — institutional behaviour makes these levels more reliable
- Manage combined passive + active exposure to any single large cap name
| Trade the Large Cap Universe With ATGL’s Rules-Based System
At AboveTheGreenLine.com we give active investors the complete framework for identifying, entering, and managing positions in the large cap universe — from the passive ETF core to the active satellite strategies that generate additional return potential. Join us Above the Green Line. |
Frequently Asked Questions
What market cap is considered large cap?
Large cap is generally defined as companies with a market capitalisation of $10 billion or more — calculated by multiplying share price by total shares outstanding. Some sources set the threshold at $5 billion; others separate mega cap ($200B+) from standard large cap ($10B-$200B). The S&P 500 index requires approximately $14.5 billion minimum market cap for inclusion (updated periodically by S&P Global).
Are large cap stocks safer than small cap?
Large cap stocks are generally less volatile than small cap stocks — more established business models, greater analyst coverage, higher institutional ownership, and more liquid trading markets. In bear markets, large caps typically fall less than small caps. However, all equity tiers decline in severe bear markets — the asset class (stocks vs bonds) is a bigger safety determinant than the cap tier. ‘Safer’ in the context of small vs large cap means lower volatility, not protection from equity market downturns.
What ETF covers large cap stocks?
The three most traded large cap ETFs are SPY (SPDR S&P 500, ~0.095% ER), IVV (iShares S&P 500, ~0.03% ER), and VOO (Vanguard S&P 500, ~0.03% ER) — all tracking the S&P 500. For broader large cap exposure: VV (Vanguard Large Cap, ~0.04% ER) tracks the CRSP U.S. Large Cap Index; IWB (iShares Russell 1000, ~0.15% ER) covers the 1,000 largest U.S. companies. Verify all expense ratios at fund provider websites.
What is the difference between large cap growth and large cap value?
Large cap growth stocks are large companies with above-average revenue and earnings growth rates — typically trading at higher price-to-earnings multiples — overrepresented in technology and consumer discretionary. Large cap value stocks are large companies trading below their estimated intrinsic value — lower P/E multiples, often financials, healthcare, and energy. Growth tends to outperform in low-rate, economic expansion environments; value tends to outperform when rates rise and economic growth is moderate.

Related Articles

Moving Average Crossover Strategy: Using Trend Confirmation to Reduce Emotional Trading
ESPP Explained: The Employee Stock Purchase Plan Most Workers Leave Money On the Table By Ignoring
What Is a Bull Market? The Complete Guide Every Trader Needs Before the Next One Starts

Stock Market Hours: The ONLY Trading Windows That Actually Matter (Most Traders Get This Wrong)