For busy investors that don’t have time to Swing Trade, we now have a simple Strategy:
Top Pick of the Week. You Buy the “Pick” on Monday morning, and then Sell on Friday’s Close. It’s a time-efficient approach designed to capture short-term gains without requiring constant market monitoring.
This “Pick” is emailed to you with this Weekly Commentary (see below & more details here).
The Top Pick of the Week is still: Intel Corp. $INTC was down last week, so we stayed in and will Sell on the Close this Friday. ALSO Semi Fund $SMH looks good on a small pull-back.
You can view the current Weekly Stock Performance.
______________________________________________________________________________
DAILY SWING TRADING (SHORT TERM)Watch List and Charts to Buy Soon.
| Daily Swing Watch List to Buy | Daily Swing Charts to Buy |
| Current Daily Swing Positions | Current Swing Charts |
| Closed Daily Swing Results | Trading Dashboard |
12/21/2025 Markets were mixed again for the week after the Indices and Leaders dropped down to the Green Zones (probably too late to Sell for the short term). Then several Swing Trade Buy Signals kicked and we bought some of the Strongest again. Markets should hold up this week for Bonuses for Money Managers…
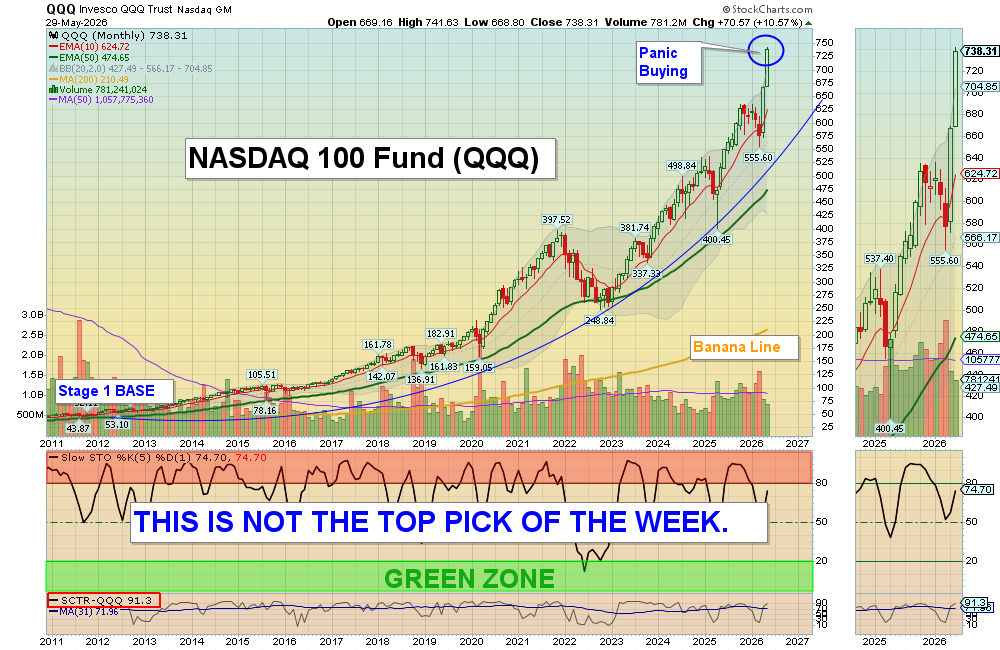
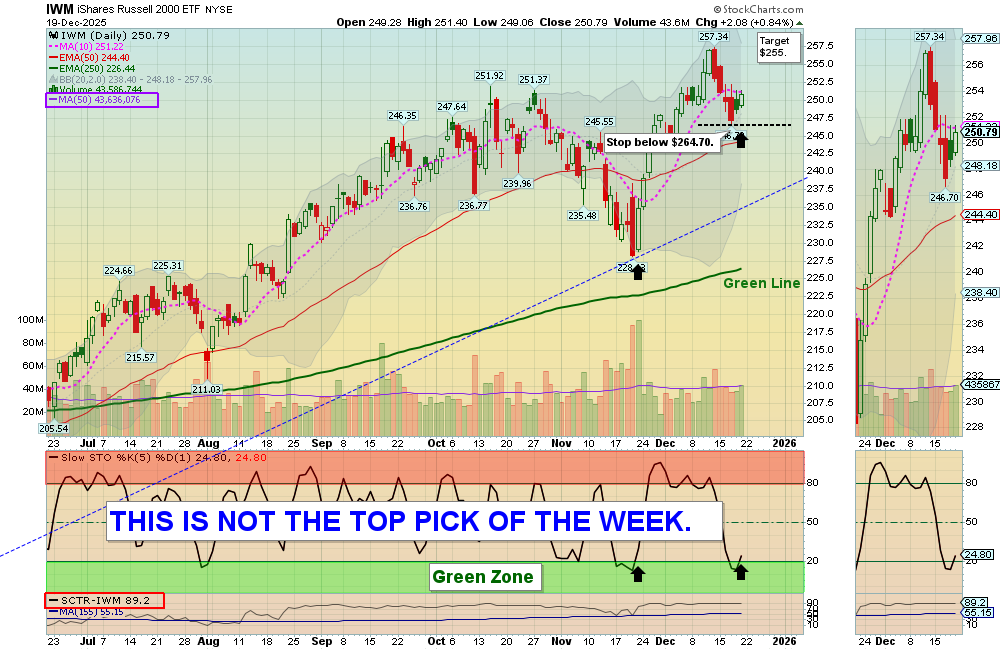
Two weeks ago the DOW 30, NYSE, & Small Caps made higher highs, but the S&P 500, MAG 7, & QQQ did not.
The major Indices must make higher highs soon for this huge rally from the April lows to continue. Otherwise this could be a Double Top (M pattern) and a Sell signal for many Technical Analysts.
We Buy the strongest Leaders that make new highs, on pull-backs. So follow the Green Line System and you should continue to win more than you lose. SEE WATCH LIST
With the Green Line System, your Money should flow into the Strongest areas and your Account value should be able to grow in both Bull and Bear Markets. Follow the MONEY, not the MEDIA.
______________________________________________________________________________
For the week the Dow was down 0.66%, the S&P 500 was up 0.10% and the NASDAQ 100 was up 0.56%. The major Indices still have a Relative Strength below 80, so you should currently own the stronger Funds here.
The Inflation Index (CRB) was down 1.07% this week and is Below the Green Line, indicating Economic Contraction.
Bonds were up 0.63% for the week, and are Above the Green Line, indicating Economic Contraction.
The US DOLLAR was up 0.31% for the week.
Crude Oil was down 1.55 % for the week at $56.55 and GOLD was up 2.34% at $4337.83.
_______________________________________________________________________
DAY TRADERS: We are doing many profitable Day Trades at our Live Trading Room on YouTube during Market hours. Please join Discord or X (Twitter) with your cell phone app for the fastest Trade Alerts and Daily email notifications during the day. Other methods of notification have been too slow.
_______________________________________________________________________
COMPLETED DAILY SWING TRADE TRADES:
LITE Lumentum Holdings Target was Hit at $365 with an 8.3% Gain.
PGEN Precigen Inc. Sold via Trade Alert at $4.20 for a 9.7 % Gain
We are now in 2 Three Star logged Swing Trading Positions for the Short Term. There are 3 investments on the Short Term Watch List.
Completed Swing Trades thru Nov 2025: 231 Trades, or 3.2% Avg. / Trade (before taxes and commissions).
______________________________________________________________________________
WEEKLY SWING TRADES – WATCH LIST
| Open Date | Symbol | Description | Industry | SCTR | Size | Last Price | Daily Change % | ATGL 60 Min | Comments | id | Strategy | Position | Sell Date | Sell Price | Purchase Price | Net Profit | Realized Gain/Loss % | ATGL Rule | Stop Loss | color | Chart | Update Date | Status | Unrealized Gain/Loss % | Volume | Post Type | # Shares | Amount Invested | Portfolio Weight | Dividend Rate | Current Yield | Current Value | Yield on Cost | Projected Annual Dividends | Total Dividends Received | Pay Back | Profit / Loss | Annualized Profit/Loss | Star Rating | Target Price | News Alert % | Target Triggered |
|---|---|---|---|---|---|---|---|---|---|---|---|---|---|---|---|---|---|---|---|---|---|---|---|---|---|---|---|---|---|---|---|---|---|---|---|---|---|---|---|---|---|---|
| 2026-06-17 | USO | US Oil Fund | Energy | 92 | ETF | $114.28 | -0.5136 | Wait for next Weekly Money Wave Close > 20 with High Volume. | 5092 | Long Term | Long | $0.00 | 0.00% | https://stockcharts.com/sc3/ui/?s=USO&a=2293225295&p=W&yr=1&mn=6&dy=0&id=p78387113253 | 2026-06-18 15:54:20 | open | 0.00% | 0 | Watch List | $0 | 0.00% | 0.00 | 0 | $0 | 0.00% | $0 | $0 | 0.00% | 0.00% | - | $135.00 | |||||||||||
| 2026-06-07 | SLV | Silver Fund | Metals | 93 | ETF | $59.05 | -0.773 | Wait for next Weekly Money Wave Close > 20 with High Volume. | 5083 | Long Term | Long | $0.00 | 0.00% | https://stockcharts.com/sc3/ui/?s=SLV&a=2284537971&p=W&yr=1&mn=6&dy=0&id=p52385594523 | 2026-06-08 19:47:29 | open | 0.00% | 0 | Watch List | $0 | 0.00% | 0.00 | 0 | $0 | 0.00% | $0 | $0 | 0.00% | 0.00% | - | $80.00 | |||||||||||
| 2026-05-26 | CTMX | Cytomx Thera. | HealthCare | 83 | Small | $2.96 | 0.1695 | Wait for next Weekly Money Wave Close > 20 with High Volume. | 5071 | Long Term | Long | $0.00 | 0.00% | https://stockcharts.com/sc3/ui/?s=CTMX&a=2273899296&p=W&yr=1&mn=0&dy=0&id=p89336138870 | 2026-05-26 19:08:23 | open | 0.00% | 0 | Watch List | $0 | 0.00% | 0.00 | 0 | $0 | 0.00% | $0 | $0 | 0.00% | 0.00% | - | $5.50 |
Weekly Green Zone Pops – Click here for scrolling charts.
WEEKLY SWING TRADES
NET Cloudflare Inc. Weekly Swing Trade Buy. Target is $238.
TLRY Tilray Inc. Slipped down to the Buy Price and was stopped out even.
Completed Weekly Swing Trades thru Nov 2025: 41 Trades, or 16.3 % / Trade (before taxes & commissions).
______________________________________________________________________________
Important Links| Top 100 | Stage Chart Investing | CNN Fear & Greed Index |
| Dividend Growth Portfolio | ETF Sector Portfolio | Dogs of the Dow |
| Long Term Strategy | Stage Chart Investing | Articles |
Alert! Market Risk is Medium (Yellow). The probability of successful Short Term Trades is better, when the % of stocks above the 50-day avg. is below 20.
Tell your Friends about the Green Line, and Help Animals.
______________________________________________________________________________
QUESTION: Andrea writes “I have been a member for a month, and still quite confused on how to use the information and various tabs. I assume one should only enter NEW TRADES so there is no confusion on goals and stop losses?
Please explain “Don’t take a loss”; do you mean make a tighter stop than the pink moving average, or the suggested stop loss ?
ANSWER: Hi Andrea. Yes you should only do new trades.
Much of Investing is WAITING. Waiting for the Markets to return to the Green Zones. 70% of Stocks move with the Markets, so Buying a Stock when the S&P 500 is in the Red Zone is not a great bet. Wait for a return to the Green Zone… it will happen.
When an Investment has a Buy Signal (Money Wave > 20) it should bounce up quickly… If the Money Wave > 50 and the Investment has not popped well, GET OUT. Don’t Take a Loss! Something might be wrong. There will be many more trades… keep your Cash ready.
WHEN YOU BUY, IS SOMETIMES MORE IMPORTANT THAN WHAT YOU BUY. The Chart Link below is longer term, but it is normally better to Buy when the Herd is Dumping to make good money (down in the Green Zone).
The link to this Chart Alert! Market Risk is MEDIUM (Yellow) is in every Weekly Email. If you subscribed after a big move up (RED ZONE), then you missed that cycle. Now have Discipline and WAIT for another Dump… It will happen.
Good trading and tell your friends!
ATGL