
Watchlist and Charts to Buy Soon.
| Daily Swing Watch List | Daily Swing Charts to Buy |
| Current Swing Positions | Current Swing Charts |
| Closed Results | Trading Dashboard |
Current Pick and Chart
| Top Pick of the Week | TPOW Stock Chart |
The Top Pick of the Week: Credo Tech. $CRDO was already sold yesterday for a solid 4% gain (Conservative Target).
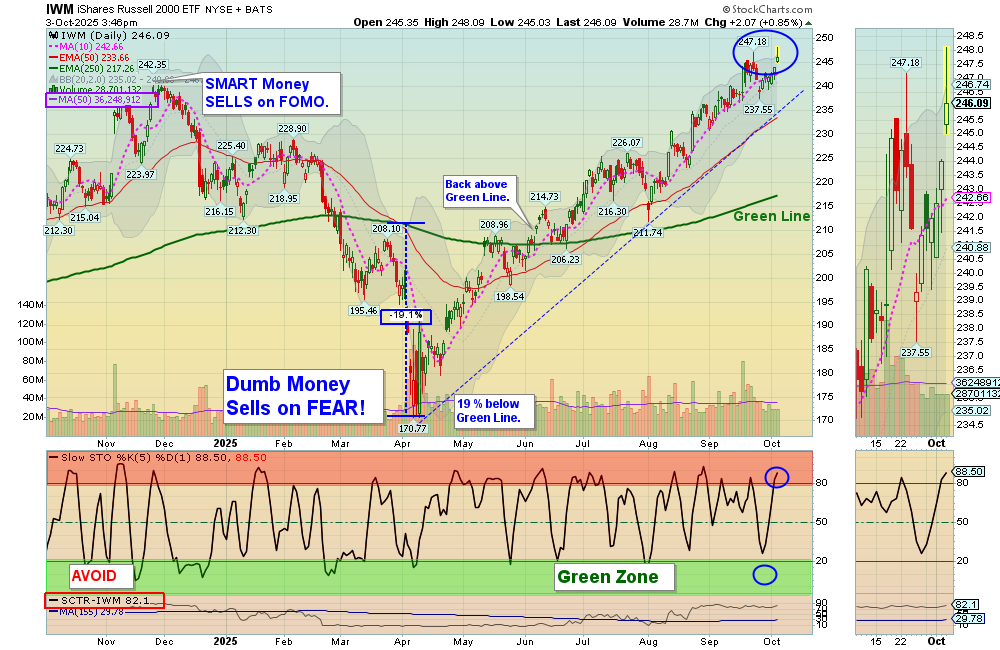
Oct 3, 2025 Today the markets opened with bullish momentum as SPY gapped slightly higher and continued upward, along with QQQ. Small caps (IWM) showed strong upside movement, and the SPDR Biotech ETF also rallied with solid strength. This reflects the impact of excessive liquidity in the markets, but it also carries the risk of a deeper correction that could shake out the herd.
Overall, the week was good as we captured strong gains on our swing trades, including selling our Top Pick of the Week (TPOW) yesterday for a 4% gain. Markets remained bullish and steady today, with relatively low volatility.
Wait for more Buy Signals coming up out of the Green Zones. WATCH LIST CHARTS
The best moves happen when the S&P 500 Index is also coming up out of the Green Zone.
______________________________________________________________________________
BUYS TODAY 10/03/2025
MP MP Materials Swing Trade Buy on the Close, but the Volume is not high (2 Star trade).
BUYS SOON
| Open Date | Symbol | Description | Industry | SCTR | Size | Last Price | Daily Change % | ATGL 60 Min | Comments | id | Strategy | Position | Sell Date | Sell Price | Purchase Price | Net Profit | Realized Gain/Loss % | ATGL Rule | Stop Loss | color | Chart | Update Date | Status | Unrealized Gain/Loss % | Volume | Post Type | # Shares | Amount Invested | Portfolio Weight | Dividend Rate | Current Yield | Current Value | Yield on Cost | Projected Annual Dividends | Total Dividends Received | Pay Back | Profit / Loss | Annualized Profit/Loss | Star Rating | Target Price | News Alert % | Target Triggered |
|---|---|---|---|---|---|---|---|---|---|---|---|---|---|---|---|---|---|---|---|---|---|---|---|---|---|---|---|---|---|---|---|---|---|---|---|---|---|---|---|---|---|---|
| 2026-05-29 | LITE | Lumentum Holdings | Telecom | 96 | Large | $889.58 | 4.0493 | Wait for next Daily Money Wave Close > 20 with High Volume. | 5075 | Short Term | Long | $0.00 | 0.00% | https://stockcharts.com/sc3/ui/?s=LITE&a=2114483003&p=D&yr=0&mn=4&dy=0&id=p73545556391 | 2026-05-29 17:34:08 | open | 0.00% | 4777583 | Watch List | $0 | 0.00% | 0.00 | 0 | $0 | 0.00% | $0 | $0 | 0.00% | 0.00% | - | $950.00 | |||||||||||
| 2026-05-27 | WTI | W&T Offshore Inc. | Energy | 94 | Small | $3.96 | 7.6087 | Wait for next Daily Money Wave Close > 20 with High Volume. | 5073 | Short Term | Long | $0.00 | 0.00% | https://stockcharts.com/sc3/ui/?s=WTI&a=2216316977&p=D&yr=0&mn=4&dy=0&id=p97472442687 | 2026-05-27 15:46:40 | open | 0.00% | 4066692 | Watch List | $0 | 0.00% | 0.04 | 1.087 | $0 | 0.00% | $0 | $0 | 0.00% | 0.00% | - | $4.70 | |||||||||||
| 2026-05-26 | USO | US Oil Fund | Energy | 99 | ETF | $138.32 | 7.1501 | Wait for next Daily Money Wave Close > 20 with High Volume. | 5069 | Short Term | Long | $0.00 | 0.00% | https://stockcharts.com/sc3/ui/?s=USO&a=1114471773&p=D&yr=0&mn=4&dy=0&id=p13018070080 | 2026-05-26 15:51:42 | open | 0.00% | 6843427 | Watch List | $0 | 0.00% | 0.00 | 0 | $0 | 0.00% | $0 | $0 | 0.00% | 0.00% | - | $150.00 |
Shop for a better price earlier in the day with Green Candle Buy Signal, on the same day that a Daily Money Wave Buy Signal will occur.
Many like to Buy the Swing Trades just before the Close, if the Money Wave is going to create a Buy Signal (Closing > 20 and up out of the Green Zone). Don’t Buy if the Security has already popped up too much. Money Wave Buy Signals are usually good for a 3-6 % move in a few days.
SELLS TODAY
ORCL Oracle Corp. Slipped down to the Buy Price and was stopped out even.
________________________________________________________________________
WEEKLY GREEN ZONE POPS (Will Price these after Friday’s Close).
WEEKLY SWING TRADING (Formerly LONG TERM)Watchlist and Charts to Buy Soon.
| Weekly Swing Watch List | Weekly Swing Charts to Buy |
| Current Weekly Positions | Current Weekly Charts |
| Closed Results | Stage Chart Investing |
DAY TRADING SETUPS. Today we had 10 scalp trades for nice Gains at our Trading Room. In this Emotional Market now, Day Trading Alerts are not being sent out on our Discord Site with Live Chatting. Please install Discord app on your PC or cell for mobile notifications. Check out our Live Stream.
Or look for Green Candle Buy Pops (Red Candle turns Green). Big Movers today: NVTS+14% QUBT +25% & RR +20%
Bonds were up today and are Above the Green Line.
Crude Oil was down $1.21 today at $60.57.
MY TRADING DASHBOARD
SWING TRADING CURRENT POSITIONS
DAY TRADING SETUPS
TRADE ALERTS
STAGE CHART INVESTING
PREVIOUS GREEN LINE STOCKS
HAVE A NICE WEEKEND!