
Sep 28, 2025.
The Top Pick of the Week System is up +77 % compounded, vs the S&P 500 up +16% (since the Oct. 7, 2024 inception).
For busy investors that don’t have time to Swing Trade, we now have a simple Strategy:
Top Pick of the Week. You Buy the “Pick” on Monday morning, and then Sell on Friday’s Close. It’s a time-efficient approach designed to capture short-term gains without requiring constant market monitoring.
This “Pick” is emailed to you with this Weekly Commentary (see below & more details here).
The Top Pick of the Week is: Credo Tech Group $CRDO to be bought on the Open on Monday, and will be sold on the Close on Friday.
You can view the current Weekly Stock Performance.
______________________________________________________________________________
DAILY SWING TRADING (SHORT TERM)Watch List and Charts to Buy Soon.
| Daily Swing Watch List to Buy | Daily Swing Charts to Buy |
| Current Daily Swing Positions | Current Swing Charts |
| Closed Daily Swing Results | Trading Dashboard |
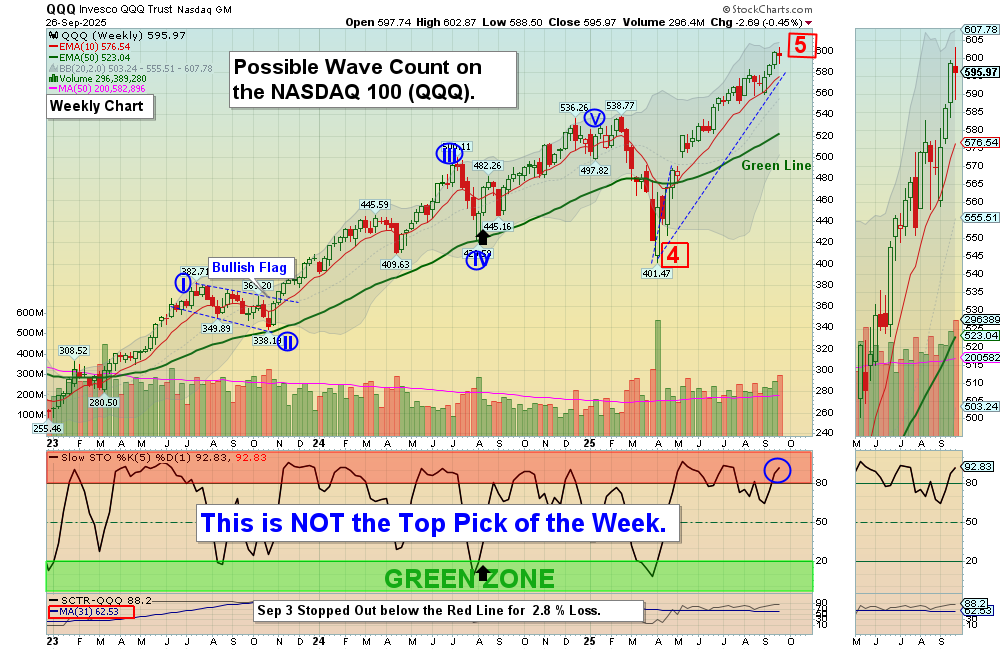
9/28/2025 Markets were slightly lower for the week as some of the Strongest Leaders had some profit taking. Last week was panic Buying and a Short Squeeze. The S&P 500, DOW 30, Small Caps, & NASDAQ 100 Indices slipped down below the Pink Lines (10-day avgs.) which created some short term Sell Signals. Now they must make higher highs again for the rally from April to continue.
The Strongest Stocks and Indices are still very overbought now after the April Fear Flush down. Smart Money has been Raising Cash to be able to Buy these Leaders on the next pull-back. The Indices will meet again with the Green Lines (much lower). Gold Miners & Silver made new highs, and Bonds were lower on FED Printing Fears.
We Buy the strongest Leaders that make new highs, on pull-backs. So follow the Green Line System and you should continue to win more than you lose. SEE WATCH LIST
With the Green Line System, your Money should flow into the Strongest areas and your Account value should be able to grow in both Bull and Bear Markets. Follow the MONEY, not the MEDIA.
______________________________________________________________________________
For the week the Dow was down 0.14%, the S&P 500 was down 0.31% and the NASDAQ 100 was down 0.45%. The major Indices still have a Relative Strength below 80, so you should currently own the stronger Funds here.
The Inflation Index (CRB) was up 2.02% this week and is Above the Green Line, indicating Economic Expansion.
Bonds were down 0.13% for the week, and are Above the Green Line, indicating Economic Contraction.
The US DOLLAR was up 0.55% for the week.
Crude Oil was up 0.25% for the week at $62.72 and GOLD was up 1.88% at $3754.06.
_______________________________________________________________________
DAY TRADERS: We are doing many profitable Day Trades at our Live Trading Room on YouTube during Market hours. Please join Discord or X (Twitter) with your cell phone app for the fastest Trade Alerts and Daily email notifications during the day. Other methods of notification have been too slow.
_______________________________________________________________________
SWING TRADE COMPLETED TRADES:
CELH Celsius Holdings Stopped Out with a -11.36 % Loss.
JOBY Joby Aviation Target was Hit at $17 with a 15.41% Gain.
JOBY Joby Aviation Stopped Out with a -5.611 % Loss.
MBOT MicroBot Medical Target was Hit at $3.50 with a 5.74% Gain.
POET Poet Tech Stopped Out with a -2.11 % Loss.
UP Wheels Up Sold via trade Alert with a 17.11% Gain.
AFRM ANET EBAY & SLDP Stopped Out even (Don’t Take a Loss!).
We are now in 1 Three Star logged Swing Trading Position for the Short Term. There are 6 investments on the Short Term Watch List.
Completed Swing Trades thru Sep 2025: 184 Trades, + 556% Total. Avg. Trade = 3.02 % Gain (before taxes and commissions).
______________________________________________________________________________
WEEKLY SWING TRADES – WATCH LIST
Watchlist is for Members Only
There are currently <strong>8</strong> investments on deck to be purchased, based on our Daily Swing Trading strategy.
| ✅ Every stock currently on deck | ✅ Real-time SCTR and price data |
| ✅ Daily % change tracking | ✅ Entry criteria and comments for each pick |
|
Already a Member? 🔒 LOG IN → |
Not a Member Yet? VIEW MEMBERSHIP PLANS → |
Current Watchlist (Preview)
Become a member to see exactly which stocks are on deck and why.
| Open Date | Symbol | Description | SCTR | Last Price | Daily Change % | Comments |
|---|---|---|---|---|---|---|
| 🔒 | 🔒 | 🔒 | 🔒 | 🔒 | 🔒 | Members Only |
| 🔒 | 🔒 | 🔒 | 🔒 | 🔒 | 🔒 | Members Only |
| 🔒 | 🔒 | 🔒 | 🔒 | 🔒 | 🔒 | Members Only |
| 🔒 | 🔒 | 🔒 | 🔒 | 🔒 | 🔒 | Members Only |
| 🔒 | 🔒 | 🔒 | 🔒 | 🔒 | 🔒 | Members Only |
| 🔒 | 🔒 | 🔒 | 🔒 | 🔒 | 🔒 | Members Only |
| 🔒 | 🔒 | 🔒 | 🔒 | 🔒 | 🔒 | Members Only |
| 🔒 | 🔒 | 🔒 | 🔒 | 🔒 | 🔒 | Members Only |
⭐ Join today to see our full watchlist and get alerted the moment we buy.
BECOME A MEMBER →Past performance is not indicative of future results.
Weekly Green Zone Pops- Click here for scrolling charts.
WEEKLY SWING TRADES
BUYS
TOI Oncology Institute Weekly Swing Trade Pop was good for 13.5 %. Target is $4.10.
SELLS
VNET 21 Vianet Group Target was Hit at $11 with a 57.6 % Gain.
Completed Weekly Swing Trades thru Aug 2025: 24 Trades, +494% Total, or 20.6 % / Trade (before taxes & commissions).
______________________________________________________________________________
Important Links| Top 100 | Stage Chart Investing | CNN Fear & Greed Index |
| Dividend Growth Portfolio | ETF Sector Portfolio | Dogs of the Dow |
| Long Term Strategy | Stage Chart Investing | Articles |
Alert! Market Risk is Medium (Yellow). The probability of successful Short Term Trades is better, when the % of stocks above the 50-day avg. is below 20.
Tell your Friends about the Green Line, and Help Animals.
______________________________________________________________________________
QUESTION: John C. writes “Hi. I have been using your methods with quite good success over the past year, but lately I have been wondering something. Sometimes you post a daily chart for a company, but other times you post a weekly chart. For swing/momentum trading, which chart is best to go by, because looking at both, side to side, the Money Waves are quite different.
Many thanks, John C.
ANSWER: Hi John. The Green Line System is based on Buying the Leaders in the Green Zone, and taking Profits in the Red Zone.
The Daily Chart cycle usually takes 1-3 weeks and the Weekly Chart takes 1-3 months. If you Buy the Weekly, don’t look at the Daily, as the Daily will cycle thru many times and be confusing. Pick only 1 Time Frame, and stick with it.
Many will use a shorter term Time Frame for ENTRY only, then go back to your Main Chart decision.
Thanks for writing.
ATGL


