By ATGL
Updated August 25, 2025
Precision in market timing separates successful traders from those who struggle with inconsistent results. While price action provides valuable insights, combining it with volume-based analysis offers a deeper understanding of market dynamics. Traditional charting tools focus primarily on price movements over time, but volume-based indicators reveal where actual trading activity concentrates at specific price levels.
The volume profile indicator stands out as one of the most powerful tools for identifying high-probability entry and exit zones. This comprehensive guide explores how this indicator functions, its key components, and practical strategies to enhance your market precision.
What Is the Volume Profile Indicator?
The volume profile indicator visualizes market activity by price, displaying how much trading volume occurred at each price level during a specified time period. Unlike traditional volume bars that show total volume over time intervals, this tool presents a horizontal histogram showing volume distribution across price levels.
This unique visualization is critical as an indicator that shows a volume profile and organizes it in a way that reveals market structure and participant behavior. High-volume areas typically indicate price levels where significant buying or selling interest exists, often forming strong support or resistance zones.
The indicator plots volume data horizontally, creating a profile that immediately highlights where the most trading activity occurred. This perspective helps you understand market acceptance or rejection at specific price levels, providing context that traditional volume analysis cannot match.
Key Components Of Volume Profile
Understanding the volume profile’s core elements is essential for effective implementation. Three primary components form the foundation of volume profile analysis.
Point Of Control (POC)
The Point of Control represents the price level with the highest trading volume during the analyzed period. This level often acts as a magnet for price action, frequently serving as dynamic support or resistance. When price moves away from the POC and returns, it typically finds significant reaction at this level due to the established trading interest.
Professional traders monitor POC levels across multiple timeframes to identify confluence zones where short-term and long-term volume peaks align, creating particularly strong price levels.
Value Area, High And Low
The value area encompasses the price range where a specified percentage of total volume traded, typically 70%. The value area’s high and low boundaries define this range, creating a framework for understanding normal trading activity versus outlier price movements.
Price action outside the value area often indicates imbalanced market conditions, potentially signaling momentum continuation or exhaustion depending on the broader market context.
High And Low Volume Nodes
High-volume nodes represent price levels with significant trading activity, often acting as support or resistance. These areas typically slow price movement due to the established interest at those levels.
Low-volume nodes, conversely, indicate price levels with minimal trading activity. These areas often represent zones where price can move rapidly due to thin liquidity, making them ideal for identifying potential breakout or breakdown levels.
How To Use The VPVR Indicator?
The Volume Profile Visible Range (VPVR) indicator adapts the volume profile concept for practical trading applications. Most trading platforms, including TradingView, offer VPVR functionality that automatically calculates volume distribution for the visible chart range.
For intraday trading, set the VPVR to analyze the current session’s data, focusing on POC levels and value area boundaries for scalping opportunities. Day traders often use five-minute or 15-minute charts with session-based volume profiles to identify key levels for the trading day.
Swing traders benefit from longer-term volume profiles spanning several weeks or months. This approach reveals significant institutional levels and major support/resistance zones that persist across multiple trading sessions.
The indicator updates dynamically as new price and volume data become available, requiring you to monitor changes in POC placement and value area boundaries throughout the trading session.
Popular Volume Profile Strategies For Traders
Professional volume profile strategies combine this indicator with complementary analysis tools for enhanced accuracy. The most effective approaches integrate volume profile with trend identification and momentum indicators.
Breakout confirmation represents one of the most reliable volume profile strategies. When price breaks above or below a high-volume node with increased volume, it often signals a continuation move. Combine this approach with VWAP analysis to confirm the breakout’s validity.
Mean reversion strategies focus on price movements away from the POC or value area. When price extends significantly beyond the value area high or low, look for opportunities to fade the move, and expect price to return toward areas of established volume.
Range trading strategies utilize value area boundaries as dynamic support and resistance levels. Traders buy near the value area low and sell near the value area high, particularly effective in sideways markets with well-defined volume profiles.
Integrating Volume Profile With Market Context
Volume profile analysis becomes most powerful when combined with broader market context. The indicator adds context beyond price action alone by revealing the underlying supply and demand dynamics that drive price movements.
Successful integration requires understanding how volume profiles interact with trend identification techniques. In trending markets, volume profiles help identify potential reversal levels or continuation zones based on how price reacts to established volume areas.
Market structure analysis benefits significantly from volume profile integration. Major swing highs and lows often coincide with significant volume levels, providing confluence for important decision points.
Volatility considerations also play a crucial role. During high-volatility periods, volume profiles may develop more quickly, requiring you to adjust your timeframes and expectations accordingly.
Which Volume Profile Indicator Is Best?
Platform selection significantly impacts volume profile effectiveness. TradingView offers comprehensive volume profile tools, including VPVR, fixed range profiles, and session-based profiles. Professional trading platforms typically provide more customization options and faster data processing.
Consider your trading style when selecting volume profile tools. Day traders benefit from platforms offering real-time volume profile updates and session-based analysis. Swing traders may prioritize longer-term profile capabilities and historical data access.
The optimal indicator balances detail with simplicity. Overly complex volume profiles can create analysis paralysis, while oversimplified versions may miss critical market insights. Most successful traders use standard VPVR settings with minor customizations based on their specific market focus.
Leverage Volume Profile To Trade Smarter
The volume profile indicator transforms how traders understand market dynamics by revealing where actual trading activity concentrates. This tool provides unprecedented insight into support and resistance levels, market balance, and potential breakout zones.
Mastering volume profile analysis requires consistent practice and integration with existing trading strategies. Start with basic POC and value area analysis before advancing to more complex multi-timeframe techniques.
Ready to enhance your trading precision with professional-grade tools and strategies? Discover comprehensive trading education and advanced market analysis techniques through Above the Green Line’s membership programs, designed to help you achieve consistent profitability through systematic approaches to market analysis.

Related Articles
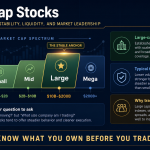
Large Cap Stocks: What They Are, Why They Matter, and How to Build a Portfolio Around Them

Moving Average Crossover Strategy: Using Trend Confirmation to Reduce Emotional Trading
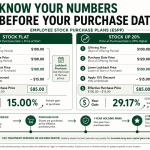
ESPP Explained: The Employee Stock Purchase Plan Most Workers Leave Money On the Table By Ignoring
What Is a Bull Market? The Complete Guide Every Trader Needs Before the Next One Starts