
By ATGL
Updated May 24, 2025
In the fast-paced world of trading, numbers alone don’t tell the full story; understanding context is key. Enter Relative Volume, or RVOL, a crucial tool that compares current trading activity against historical norms to spot high-potential setups. By going beyond raw volume numbers, RVOL offers a nuanced insight into how today’s trading volume stacks up against the past.
RVOL’s elegance lies in its ability to reveal unusual trading activity, potentially signaling strong moves on the horizon. This article delves into how RVOL is calculated, illustrating its role in confirming breakouts and volume surges and how it pairs effectively with other indicators for optimal timing in trades. Whether you’re a day trader or a swing trader, understanding RVOL could be your secret weapon in spotting the best opportunities.
As we explore RVOL’s applications and limitations, you’ll learn how it fits into a smarter, more informed trading strategy. Prepare to uncover the intricacies of RVOL and elevate your trading game by recognizing its potential to identify game-changing setups.
How RVOL Works in Trading
When analyzing stocks, traders need more than just numbers. Relative Volume, or RVOL, plays a key role here. It helps compare a stock’s current trading volume to historical volumes. This measure offers deep insights into trading activity levels. High RVOL often means big price moves, such as breakouts or reversals, may occur. These shifts suggest strong trends or weakening momentum.
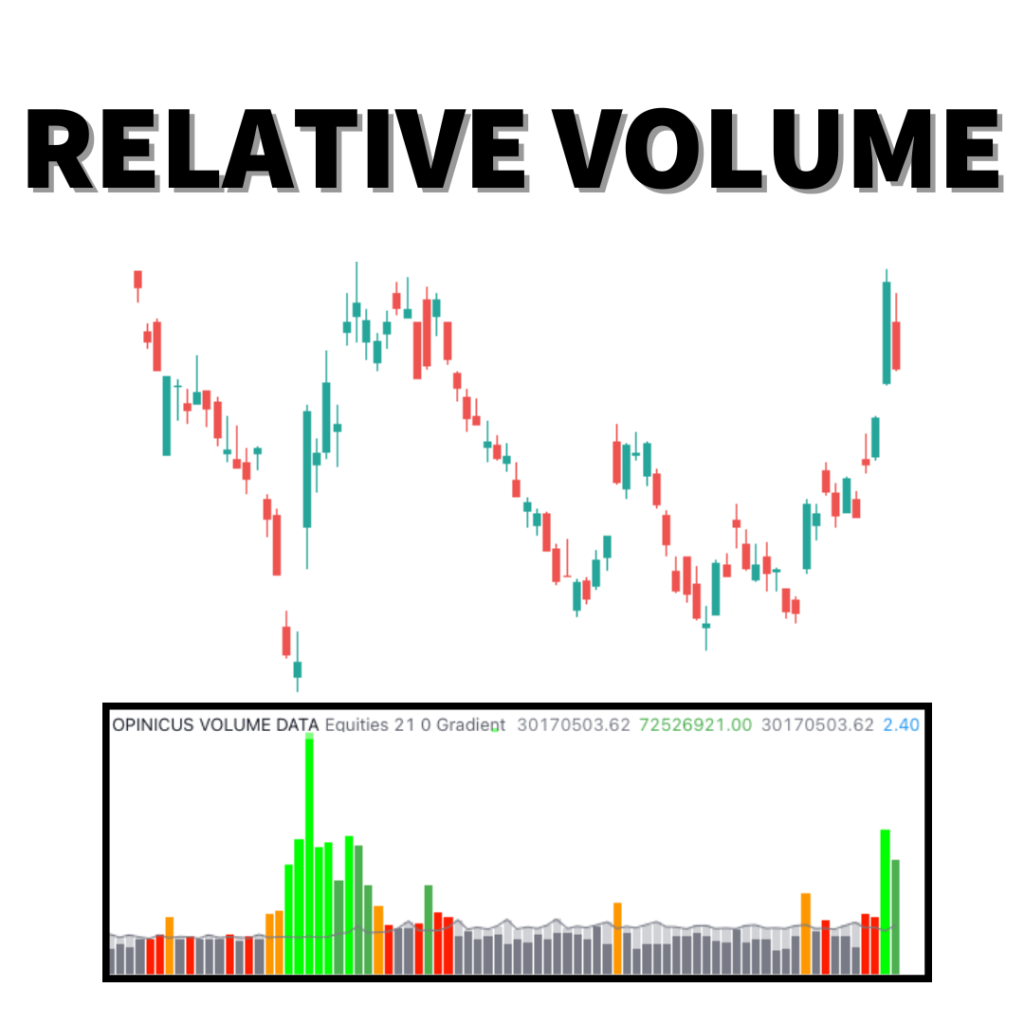
RVOL can be visualized with line graphs or histograms. Adjusting these formats helps traders use RVOL effectively. For example, an RVOL value greater than 1.0 indicates that today’s volume is higher than usual. This suggests increased market interest and potential volatility. Conversely, an RVOL less than 1.0 implies reduced trading activity.
How to Read the RVOL Indicator:
- RVOL > 1.0: High market interest, increased liquidity, potential price volatility
- RVOL < 1.0: Low market interest, decreased liquidity, reduced price volatility
Though RVOL provides useful context, it can sometimes mislead. Volume spikes from unique events might not represent true market changes. By understanding RVOL, traders can enhance market timing and make better decisions.
How to Calculate RVOL (Relative Volume Indicator)
Understanding RVOL, or Relative Volume, can transform how you analyze trading volume. RVOL tells us how current trading activity stacks up against historical averages.
RVOL Formula:
RVOL = Current Volume / Average Volume
Use a defined period, like 10, 20, or 30 days, for the average volume.
Example:
If today’s volume is 500,000 shares and the 10-day average is 250,000 shares:
RVOL = 500,000 / 250,000 = 2.0
An RVOL of 1 means normal activity. Above 1, trading activity is high; below 1, it’s low. Values over 4.0 are quite unusual and indicate a volume spike.
Here’s a quick reference table:
| RVOL Value | Interpretation |
| Below 1 | Reduced activity |
| 1 | Normal activity |
| Above 1 | Increased activity |
| Above 4 | Atypically high activity |
Pair RVOL with other indicators for spotting trading opportunities. This makes RVOL essential in your trading arsenal!
How RVOL Helps Confirm Breakouts and Volume Surges
When it comes to trading, looking at just the numbers isn’t always enough. That’s where RVOL, or Relative Volume, comes in. It tells us how current trading activity compares to what’s normal for a given stock. This can be super useful in trading strategies like breakouts.
How RVOL Confirms Breakouts:
- High RVOL Signals Support: Strong volume during a breakout suggests durability
- Validates Key Levels: Confirms breakout legitimacy through increased activity
- Pattern Breakouts: Reinforces traditional breakout signals (e.g., triangles)
RVOL vs. Raw Volume:
- Avoid False Signals: High raw volume alone isn’t always enough — RVOL adds context
Frequently Asked Questions:
- Is high RVOL good? Often yes — it shows elevated interest
- Can RVOL alone confirm breakouts? No — use it with other tools
Pairing RVOL with Momentum Indicators for Better Timing
Pairing RVOL, or Relative Volume, with momentum indicators can greatly enhance trading strategies. RVOL shows how current trading activity compares to historical norms. When combined with indicators like RSI and MACD (Relative Strength Index or Moving Average Convergence Divergence), it helps confirm the strength of market moves.
Using RVOL with RSI can improve entry timing. When RVOL is high, and RSI shows an overbought or oversold condition, it signals a strong potential for a price change. This combination helps traders confirm the conviction behind market movements.
The stochastic oscillator is another useful tool when paired with RVOL. High RVOL levels during a crossover in the Stochastic Oscillator can indicate possible reversals or breakouts. This helps traders better time their entries and exits.
Here’s how using RVOL with these technical indicators can help:
- Identify Trend Strength: Confirms momentum behind moves.
- Pinpoint Entries/Exits: Spots high-probability trading points.
- Mitigate False Signals: Reduces risks during unusual activity.
By combining these tools, traders can better differentiate between short-term fluctuations and sustainable market trends. This approach makes it easier to spot strong trading opportunities. This approach improves decision-making and helps you better recognize early breakouts.
Day Trading vs. Swing Trading with RVOL
In trading, analyzing volume is about more than just raw numbers. That’s where RVOL, or Relative Volume, comes in. It compares current trade activity to historical norms. This helps traders gauge how today’s volume stacks up against past trends.
Day Trading with RVOL:
Day traders use RVOL to make quick decisions. An RVOL above 2 might signal a breakout. This indicates high interest and potential price movement. RVOL helps day traders spot trends and possible reversals. It measures volume changes over time, offering insights into a stock’s activity level.
- RVOL > 2: May signal a breakout or surge
- Use: To identify intraday opportunities and momentum shifts
Swing Trading with RVOL:
Swing traders look for RVOL levels between 1.5 and 2. They use it to confirm trend strength. This helps them manage risk and choose when to enter or exit a trade. RVOL acts as a support tool to validate other indicators.
- RVOL between 1.5 – 2: Used to confirm trend strength
- Use: To validate entry/exit points in multi-day trades
| Trading Style | Preferred RVOL | Goal |
| Day Trading | Above 2 | Identify breakouts, reversals |
| Swing Trading | 1.5 – 2 | Confirm sustained trends |
Both approaches benefit from RVOL’s insight into volume-based interest and liquidity.
Limitations of RVOL in Trading
While RVOL is a useful tool, it has limitations. First, as a relative metric, RVOL doesn’t show absolute volume levels. This can miss broader market context. External factors, such as news or macroeconomic events, can spike RVOL values. This can lead to misleading interpretations.
In some cases, RVOL may give false signals. Large block trades or isolated events can cause volume fluctuations that don’t reflect true market sentiment. RVOL relies on historical averages. So, it may miss fundamental changes in a stock’s trading volume or market conditions.
Also, RVOL may not show true trading interest if it doesn’t account for anomalies. Irregular trading days can skew the data. In thinly traded stocks or around earnings reports, RVOL might give misleading signals.
It’s crucial not to rely on RVOL alone. Pair it with other indicators like price action for a fuller picture. Always consider the context before making trading decisions.
- Not Absolute: A relative metric; doesn’t reflect total volume
- Can Be Misleading: Large block trades or news spikes can skew the ratio
- Doesn’t Adjust for Outliers: Abnormal days can distort historical averages
- Thinly Traded Stocks: Can show misleadingly high RVOL values
That’s why it’s crucial to pair RVOL with price action and additional indicators to get the full picture.
Make RVOL Part of a Smarter Trade Setup Strategy
When it comes to trading, understanding volume isn’t just about looking at raw numbers. RVOL, or Relative Volume, provides deeper insights by comparing current trading activity to historical norms. This can help traders spot unusual market movements.
RVOL is a technical analysis tool that can highlight when a stock is trading more or less than usual. This can inform timing decisions, helping traders decide when to enter or exit a trade. When RVOL is high, it often marks stronger trends or potential breakouts. On the other hand, low RVOL might indicate a trend reversal.
Using RVOL effectively can also enhance risk management. During periods of high activity, traders might adjust their position sizes or set tighter stop losses. Here’s a simple breakdown:
| RVOL | Market Insight |
| High RVOL | Indicates strong trends or breakouts |
| Low RVOL | May signal weakening interest or reversals |
Pair RVOL with complementary tools for optimal risk management. Adjust position sizes and stop-losses during high-RVOL situations to better control trade exposure.
For a deeper dive into RVOL tactics and to refine your trading strategy, check out Above the Green Line’s membership options.

Related Articles

Moving Average Crossover Strategy: Using Trend Confirmation to Reduce Emotional Trading

ESPP Explained: The Employee Stock Purchase Plan Most Workers Leave Money On the Table By Ignoring

What Is a Bull Market? The Complete Guide Every Trader Needs Before the Next One Starts

Stock Market Hours: The ONLY Trading Windows That Actually Matter (Most Traders Get This Wrong)
