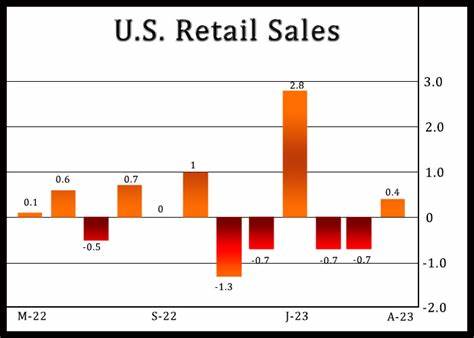
Understanding the Retail Sales Report
The Retail Sales Report is a crucial economic indicator that provides insights into consumer spending habits in the United States. Published monthly by the U.S. Census Bureau, this report measures the total receipts of retail stores, encompassing a wide array of goods and services. The data is essential for economists, policymakers, and investors, as it reflects the health of the economy and influences various sectors.
Key Components of the Retail Sales Report
- Total Sales Figures: The report provides a comprehensive total of retail sales across various categories, including automotive, clothing, electronics, and food services. This overall figure is often compared to previous months to gauge growth or contraction.
- Core Retail Sales: Excluding volatile categories such as automobiles, building materials, and gas, core retail sales offer a clearer view of underlying consumer spending trends. This measure is particularly important for understanding the true state of the economy without the influence of price fluctuations.
- Year-over-Year Comparisons: Retail sales figures are often presented in both monthly and annual formats, allowing for year-over-year comparisons that help analysts identify longer-term trends.
- Sales by Sector: The report breaks down sales by sector, providing valuable insights into which areas of retail are performing well or facing challenges. This segmentation is critical for identifying growth opportunities and potential investment risks.
Impact on the Investment Community
The Retail Sales Report is closely monitored by the investment community due to its implications for economic growth and consumer behavior.
1. Market Sentiment and Investor Confidence
Strong retail sales figures often boost market sentiment and investor confidence. Increased consumer spending typically signals a healthy economy, which can lead to rising stock prices as investors anticipate higher corporate profits. Conversely, disappointing retail sales can trigger market declines, reflecting concerns about economic weakness.
2. Sector Performance
Different sectors react variably to retail sales data. For instance, strong sales in consumer discretionary goods indicate robust consumer confidence, benefiting sectors such as retail, restaurants, and travel. In contrast, weak sales may prompt investors to shift their focus toward defensive sectors like utilities and consumer staples, which tend to perform better during economic downturns.
3. Monetary Policy Implications
Retail sales data plays a significant role in shaping monetary policy. Central banks, particularly the Federal Reserve, analyze these figures to assess economic conditions. Strong sales may prompt the Fed to consider tightening monetary policy to prevent overheating, while weak sales can lead to accommodative measures to stimulate growth.
4. Bond and Currency Markets
Retail sales reports can also influence bond yields and currency values. Rising retail sales may lead to increased bond yields as investors expect higher inflation and interest rates. Conversely, weaker sales can result in lower yields as investors seek safety in government bonds. In currency markets, strong U.S. retail sales can strengthen the dollar, while weak sales may lead to depreciation.
Insights from the Retail Sales Report
- Economic Health Indicator: The Retail Sales Report serves as a leading indicator of economic health, reflecting consumer confidence and spending trends. It is often used by analysts to predict GDP growth, as consumer spending constitutes a significant portion of economic activity.
- Inflation Trends: Changes in retail sales can also indicate inflationary pressures. If sales increase but inventory levels remain low, it may suggest rising prices due to increased demand. Conversely, stagnant sales in the face of rising prices can indicate consumer hesitance to spend, signaling potential economic concerns.
- Consumer Behavior Analysis: The report provides valuable insights into changing consumer preferences and behaviors. By analyzing sector performance, investors can identify emerging trends, such as shifts towards e-commerce or sustainable products, allowing them to adapt their investment strategies accordingly.
- Impact on Employment: The health of the retail sector has direct implications for employment. Strong retail sales often lead to increased hiring, while weak sales may result in layoffs or reduced hiring. Analysts monitor employment trends in conjunction with retail sales data to gauge overall economic health.
Economic Cycles and Retail Sales
The Retail Sales Report is integral to understanding economic cycles:
- Expansion: During economic expansions, retail sales typically increase as consumer confidence grows and spending rises. Investors may focus on growth stocks during these periods, anticipating rising corporate profits.
- Peak: At the peak of the economic cycle, retail sales may begin to slow as consumers reach spending limits. Investors may start to diversify their portfolios in anticipation of a potential downturn.
- Contraction: In times of economic contraction, retail sales often decline as consumers cut back on spending. Investors may shift towards defensive stocks and safe-haven assets as uncertainty increases.
- Trough: At the trough of the cycle, retail sales may stabilize or begin to recover, signaling the start of an economic rebound. Investors often look for undervalued assets during this phase, anticipating future growth.
Conclusion
The Retail Sales Report is a vital economic indicator that provides essential insights into consumer spending patterns, economic health, and investment opportunities. By analyzing retail sales data, investors can make informed decisions about asset allocation, sector exposure, and risk management. As a key gauge of economic performance, the report shapes market sentiment and influences various financial markets, making it essential for investors to monitor its implications closely.

