By ATGL
Updated February 16, 2026
The dividend payout ratio (DPR) is a key metric for assessing a company’s financial health and its commitment to returning profits to shareholders. This ratio helps you determine how earnings are allocated between dividends and growth. This article will explore the definition, formula, and practical applications of the dividend payout ratio, providing clarity on its significance in investment decisions.
What Is Dividend Payout Ratio?
The dividend payout ratio is the percentage of a company’s earnings that are paid out to shareholders as dividends. It’s an essential indicator of how a company balances rewarding shareholders with dividends and reinvesting profits for future growth. A higher payout ratio typically suggests a mature company with stable earnings, while a lower ratio may indicate that a company is reinvesting a significant portion of its earnings to fuel growth.
Understanding the Dividend Payout Ratio Formula
The formula for calculating the dividend payout ratio is straightforward:
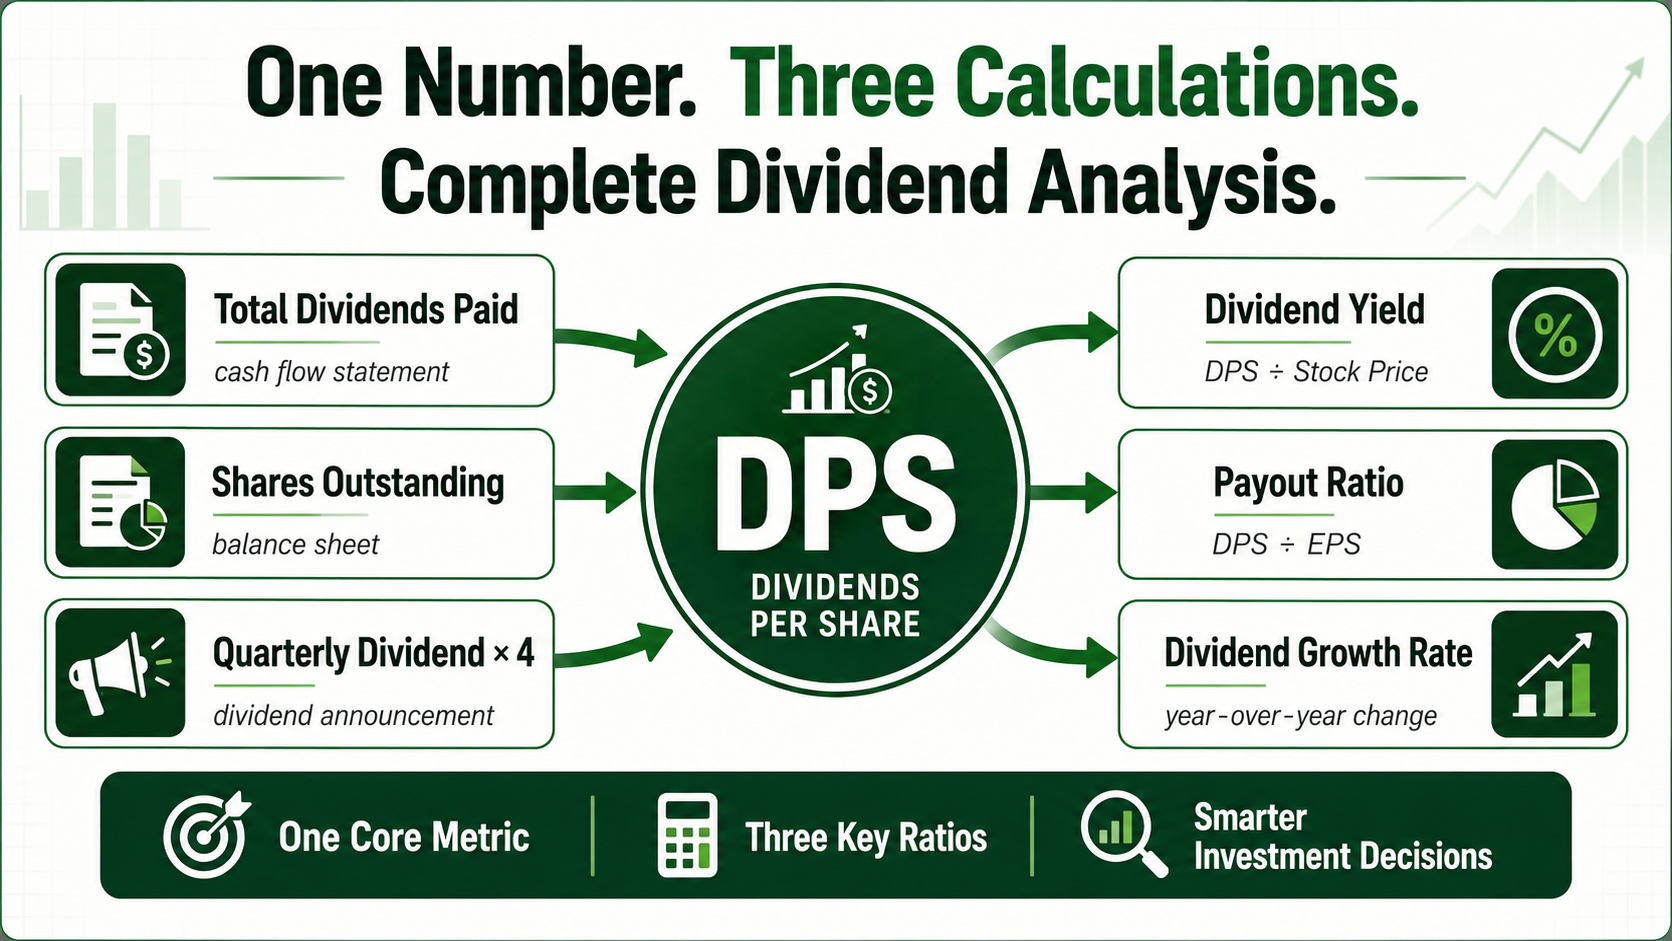
Dividend Payout Ratio = (Total Dividends Paid / Net Income) × 100
Example: Calculating Dividend Payout Ratio
Consider a company with a net income of $2 million and total dividends paid amounting to $800,000. Using the formula:
DPR = ($800,000 / $2,000,000) × 100 = 40%
Here, the company pays out 40% of its earnings as dividends, indicating a balance between returning income to shareholders and retaining capital for future growth.
What Is a Good Dividend Payout Ratio?
A “good” dividend payout ratio depends on the company’s industry, growth stage, and financial strategy. Generally, a payout ratio between 30% and 50% is healthy, indicating that the company is returning a reasonable portion of its earnings to shareholders while retaining enough capital to fund growth.
For mature companies with stable earnings, a higher payout ratio might be acceptable, as these firms may not require significant reinvestment. Conversely, companies focused on a dividend growth strategy often prefer a lower payout ratio to ensure that sufficient earnings are reinvested, supporting future dividend increases and long-term growth.
Factors Influencing DPR and What It Indicates
Several factors can influence the dividend payout ratio, each providing insights into a company’s operational and financial status:
- Company Profitability: Higher profitability generally enables a company to pay out more in dividends without compromising its financial stability. Companies with consistent and strong earnings can maintain or increase their payout ratios.
- Business Lifecycle Stage: Mature companies with slower growth prospects often have higher payout ratios since they have fewer reinvestment opportunities. However, younger, fast-growing companies might retain more earnings to fund expansion, resulting in lower payout ratios.
- Market Conditions: Economic downturns or industry-specific challenges may prompt companies to adjust their payout ratios. In tough times, companies might lower their dividends to preserve cash, whereas in prosperous periods, they might increase payouts to attract or retain investors.
Implications of High or Unsustainable Payout Ratios
A high dividend payout ratio can be appealing to income-focused investors, but it may also signal potential risks.
Financial Health of a Company
A payout ratio that exceeds 100% indicates that the company is paying out more in dividends than it earns, which is unsustainable in the long run. This might force the company to cut dividends in the future or rely on debt to maintain its payouts, both of which could negatively impact its financial stability. When analyzing such companies, investors often use models like the dividend discount model to assess the present value of a stock based on projected dividends, effectively highlighting the risks associated with unsustainable payout ratios.
Potential for Stock Price Volatility
Companies with high or unsustainable payout ratios may experience greater stock price volatility. Investors might perceive these companies as riskier, especially if they anticipate dividend cuts. Conversely, a sustainable payout ratio suggests that the company is likely to maintain its dividend, which can help stabilize its stock price.
Dividend Payout Ratio vs. Related Metrics
Understanding the dividend payout ratio in relation to other financial metrics provides a more comprehensive view of a company’s dividend policy.
Dividend Yield
The dividend yield represents the return on investment through dividends as a percentage of the current stock price. While the dividend payout ratio shows the proportion of earnings paid out as dividends, the dividend yield focuses on the income relative to the stock price. A high yield can be attractive, but if paired with a high payout ratio, it may signal an unsustainable dividend that could be at risk of being cut.
Retention Ratio
The retention ratio, also known as the plowback ratio, is the inverse of the dividend payout ratio, indicating the percentage of earnings retained for reinvestment. A low retention ratio means more earnings are returned to shareholders, which may appeal to income-focused investors but could limit the company’s ability to invest in growth.

Dividend Payout Ratio FAQs
How do you calculate the dividend payout ratio?
The dividend payout ratio is calculated using the formula:
Dividend Payout Ratio = (Total Dividends Paid / Net Income) × 100.
This calculation provides the percentage of net income that a company distributes to its shareholders as dividends.
What is a 60% dividend payout ratio?
A 60% payout ratio means that the company distributes 60% of its net earnings to shareholders as dividends, retaining the remaining 40% for reinvestment or other purposes. This is generally considered a balanced approach.
What does a 100% dividend payout ratio mean?
A 100% payout ratio indicates that the company pays out all of its net earnings as dividends, leaving nothing for reinvestment. While this might seem appealing in the short term, it may raise concerns about the company’s ability to sustain its operations and dividends in the future.
Maximize Your Dividend Payments With Above the Green Line
At Above the Green Line, we provide tools and insights to help you optimize your investment strategy. Whether you are focused on income generation or capital growth, understanding metrics like the dividend payout ratio is crucial. Explore our membership options to enhance your portfolio management and achieve your financial goals.

Related Articles
[pt_view id=”b47aec5l7b”]