By ATGL
Updated March 14, 2026
As an investor looking into Trade Desk Inc. (TTD), you can’t make an informed decision without first understanding its stock forecast. This article provides you with a comprehensive overview of Trade Desk’s potential, covering financial performance, analyst ratings, market trends, and strategic company moves.
Evaluating individual stocks like Trade Desk requires understanding how traders interpret financial data, market trends, and price behavior. Readers looking for a broader overview of how stocks are analyzed and traded can review the Stock Trading Guide, which explains the core principles behind stock trading and market analysis.
Trade Desk Inc. (TTD) Company Overview
Trade Desk Inc. operates a global technology platform for advertising buyers. Its platform helps ad buyers create, manage, and optimize data-driven digital advertising campaigns. The company’s emphasis on programmatic advertising has positioned it as a leader in the digital ad space.
Trade Desk’s unique selling proposition lies in its ability to leverage Big Data and artificial intelligence to deliver targeted ads across various digital channels, including display, video, audio, and social media. This approach allows advertisers to reach their intended audience more effectively, potentially increasing return on investment for their ad spend.
The company’s clientele includes major advertising agencies and brands across various industries. As digital advertising continues to grow and evolve, Trade Desk’s innovative solutions position it well to capitalize on this expanding market.
Financial Performance
Examining the Trade Desk’s financial performance through both fundamental and technical analysis will give you insights into its growth and stability. Here are some key metrics to consider:
- Year-to-Date (YTD) Return of TTD Stock: TTD has shown impressive growth over the years, and the YTD return often reflects investor confidence and market performance. Compare this return to broader market indices and industry peers to gauge relative performance.
- Valuation Measures: Analyzing TTD’s Price-to-Earnings (P/E) Ratio and EV/EBITDA are technical indicators that can help you assess the stock’s valuation relative to its earnings and cash flow, providing insights into whether the stock is overvalued or undervalued. High ratios might indicate investor optimism about future growth, while lower ratios could suggest undervaluation or concerns about future performance.
- Balance Sheet Analysis: A robust balance sheet with strong assets and manageable liabilities indicates financial health. TTD’s balance sheet strength reflects its ability to fund operations and growth initiatives without excessive debt. Pay attention to key metrics such as the current ratio, debt-to-equity ratio, and working capital to get a comprehensive view of the company’s financial position.
- Cash Flow Statement Assessment: Cash flow from operations is a critical metric. Positive cash flow suggests efficient management and operational success, which are essential for sustaining long-term growth. Look at trends in free cash flow generation, as this indicates the company’s ability to reinvest in the business or return value to shareholders through dividends or share buybacks.
- Revenue Growth: Examine TTD’s revenue growth rate over the past few years. A consistently high growth rate can be a strong indicator of the company’s market position and the effectiveness of its business model.
- Profit Margins: Analyze both gross and net profit margins. Improving margins over time can signal increasing operational efficiency and pricing power in the market.
The Trade Desk Stock Forecast: Ratings and Recommendations
Before you make your investment decisions, it helps to see what analysts are saying about TTD:
- Analyst Ratings Overview: Analysts provide a consensus rating for TTD, typically ranging from “Strong Buy” to “Sell.” These ratings aggregate various analysts’ opinions and research, offering a snapshot of market sentiment. Note that while consensus can be informative, it’s not always predictive of future performance.
- Recent Upgrades or Downgrades: Keeping track of any recent changes in analyst ratings can provide insights into the evolving perceptions of TTD’s potential. Pay attention to the reasons behind these changes, as they often reflect new information or changing market dynamics.
- Consensus Price Targets: These targets are the average of analysts’ price predictions for TTD, giving you a benchmark for future stock performance. Remember that price targets are typically set for a 12-month horizon and can change based on new information or market conditions.
- Earnings Estimates: Analyst estimates for future earnings can provide insight into expected financial performance. Compare these estimates to the company’s guidance and historical performance to gauge potential growth.
- Long-term Growth Forecasts: Look for analysts’ long-term growth projections, which can give you an idea of TTD’s potential over a three- to five-year horizon.
Factors Affecting TTD Stock Price
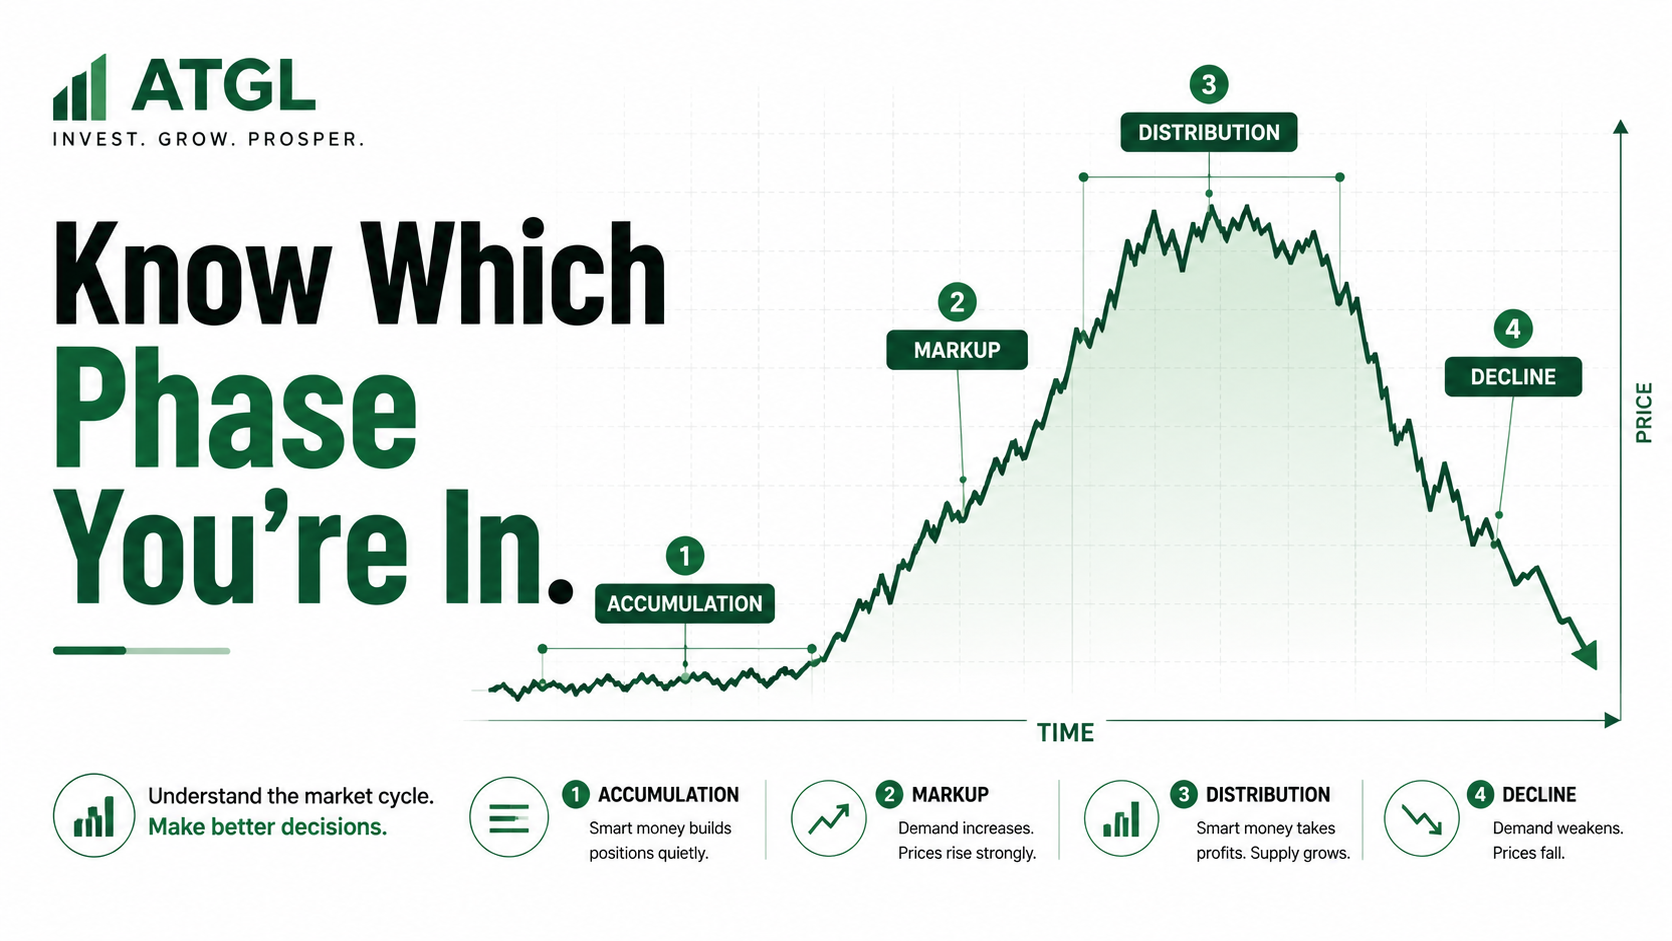
Identification of Bullish and Bearish Patterns
Recognizing patterns that indicate potential stock price increases can help you capitalize on upward trends. Some common bullish patterns include:
- Golden Cross: When a short-term moving average crosses above a long-term moving average
- Cup and Handle: A U-shaped trend followed by a slight downward drift
- Ascending Triangle: A chart pattern showing a rising trendline of lower highs and a straight trendline of highs
As for bearish patterns, you can mitigate risks by identifying signs of potential price drops before they happen. Look out for patterns, such as:
- Death Cross: When a short-term moving average crosses below a long-term moving average
- Head and Shoulders: A chart formation with three peaks, the middle being the highest
- Descending Triangle: A chart pattern showing a falling trendline of lower highs and a straight trendline of lows
Analysis of Candlestick Indicators
Candlestick charts are a popular tool among traders. They offer visual insight into market sentiment and potential price movements. Key candlestick patterns to watch for include:
- Doji: Indicates indecision in the market and potential trend reversals
- Hammer: Suggests a potential bullish reversal after a downtrend
- Engulfing Patterns: Can signal trend reversals, either bullish or bearish
Understanding Key Support and Resistance Levels
Support Levels
These are price points where a stock tends to find support as it falls. Knowing these levels can help you understand potential price floors. Support levels often coincide with the following:
- Previous lows
- Moving averages
- Psychologically important round numbers
Resistance Levels
These are price points where a stock faces resistance as it rises, and you can use these to gauge potential price ceilings. Resistance levels may be found at:
- Previous highs
- Trend lines
- Fibonacci retracement levels
Analysis of Revenue Forecast
Revenue forecasts are critical for assessing future performance. These projections can help you gauge how well TTD might perform in the coming years.
What Is the Prediction for the Trade Desk?
Analyzing market trends, company strategies, and industry growth can give you a positive revenue forecast, often signaling potential stock price appreciation. Consider the following factors:
- Digital Advertising Growth: As more advertising budgets shift to digital platforms, TTD is well-positioned to benefit from this trend.
- Technological Advancements: TTD’s continued investment in AI and machine learning could enhance its competitive edge and drive revenue growth.
- Global Expansion: The company’s efforts to expand into new markets could open up additional revenue streams.
- Partnerships and Integrations: New partnerships or integrations with major platforms could significantly boost TTD’s reach and revenue potential.
- Regulatory Environment: Changes in data privacy regulations could impact TTD’s operations, either positively or negatively.
Make the Best Investment Decisions With Above the Green Line
Investing in stocks like TTD requires careful analysis and access to reliable information. Above the Green Line offers tools and insights to help you make informed investment decisions. Our platform gives you access to real-time market data and analysis, customizable stock screening tools, expert insights and commentary, and educational resources for investors of all levels.
Sign up for an Above the Green Line membership and explore how our resources can guide your investment journey.

Related Articles
Large Cap Stocks: What They Are, Why They Matter, and How to Build a Portfolio Around Them

Moving Average Crossover Strategy: Using Trend Confirmation to Reduce Emotional Trading
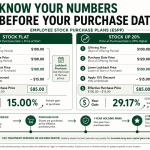
ESPP Explained: The Employee Stock Purchase Plan Most Workers Leave Money On the Table By Ignoring
What Is a Bull Market? The Complete Guide Every Trader Needs Before the Next One Starts