
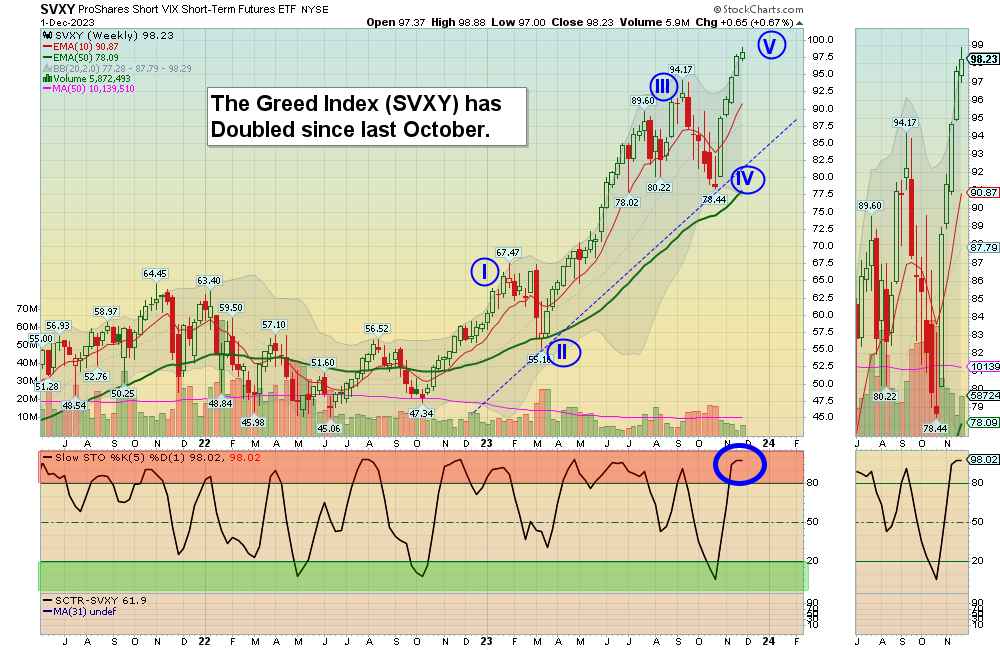
The Greed Index (SVXY) is sky high after the low in October 2022.
DAILY SWING TRADING (SHORT TERM)Watch List and Charts to Buy Soon.
| Daily Swing Watch List to Buy | Daily Swing Charts to Buy |
| Current Daily Swing Positions | Current Swing Charts |
| Closed Daily Swing Results | Trading Dashboard |
12/3/2023 Markets were slightly higher again for the week, as T-Bonds continued up and long term Rates fell. The Herd is betting on the Fed to End Tightening soon, on hopes that Inflation and Interest Rates have peaked. That is very “logical”, but the Herd is usually wrong. Historically lower Inflation and Rates would indicate a weakening Economy. But for 14 years, the FED has been able to Print “magic money” to save the Stock Market.
The Herd is panic Buying Stocks now, according to the Greed Index (SVXY) above. So expect some Bad News to come out from the Media, for another Fear Flush (like in October).
Long term Interest Rates should go up once more to retest the recent 5.1% Rate. Then if Rates Double Top or make a lower high, longer term Interest Rates could fall and meet again with the Green Line around 4% (longer term).
The Strongest Stocks and Indices are quickly back up to the September Resistance. We have taken profits on many Buy Positions since the October Fear Flush down. For nimble investors, this could be a chance to raise CASH and try to Buy Stocks lower on the next Fear Flush. Please check the Current Positions page and tighten your Sell Stop Losses if you are nervous about the Stock Market.
If you continue to Follow the Green Line System, your Money should flow into the Strongest areas and your account value should be able to grow in both Bull and Bear Markets. Follow the MONEY, not the MEDIA.
______________________________________________________________________________
Recent GAINS this week:
EDU Target was Hit on New Oriental Ed. for a 70.3% Gain. (Long Term Portfolio).
ITB Target was hit on Home Building Fund for a 9.6% Gain (Long Term Portfolio).
X Target was Hit on US Steel Group at $35.50 for a 3.3% Gain.
______________________________________________________________________________
For the week the Dow was up 2.61%, the S&P 500 was up 0.83% and the NASDAQ 100 was up 0.11%. Many of the major Indices still have a Relative Strength below 80, so you should currently own the stronger Funds here.
The Inflation Index (CRB) was down 0.45% for the week and is Below the Green Line, indicating Economic Contraction.
Bonds were up 3.88% for the week, and are Below the Green Line, indicating Economic Expansion.
The US DOLLAR was down 0.10% for the week and is Below the Green Line.
Crude Oil was down 1.95% for the week at $74.07 and GOLD was up 4.33% at $2089.70.
_______________________________________________________________________
We are doing many micro Day Trades on our new Discord Trading Hub (free). Please join Discord on your cell phone app for day trading mobile notifications during the day. Other methods of notification have been too slow. Also, please check our our Live Trading Room on YouTube during Market hours.
More action this week on the Day Trading Scrolling Charts, and Day Trading Charts for Indices & Large Caps.
_____________________________________________________________________________________________
MONEY BUYS SOON:
We are in now in 4 logged Swing Trading Positions for the Short & Medium Term. There are 5 investments on the Short Term Watch List.
Be patient and WAIT for Green Zone Buy Signals!
LONG TERM INVESTMENTS:
Long Term Scrolling Charts (Real Time)
AFRM AFFIRM HOLDINGS Shot up 43 % this week on 179 Mil shares!
AI C3 AI INC. Closed above $30.08 this week but Volume was not High. AVOID.
PINS PINTEREST INC. Finally squirted after $30.86 Break Out. Wait for next daily Green Zone Buy cycle.
RIG TRANSOCEAN INC. Buy above $7.05 with High Volume with a 3% Trailing Sell Stop Loss below it.
RRPIX RISING RATE MUTUAL FUND Wait for next Weekly Money Wave Close > 20.
RWM INVERSE SMALL CAP FUND Buy above $26.55 with High Volume with a 3% Trailing Sell Stop Loss below it.
STNE STONECO LTD. Closed above $14.83 this week but Volume was not High. Wait for next daily Green Zone Buy cycle.
TAL TAL EDUCATION GROUP Broke Out above $10.45 and shot up 20% this week. Wait for next daily Green Zone Buy cycle.
__________________________________________________________________________________________
My Trading Dashboard
Swing Trading Scrolling Charts
Day Trading Scrolling Charts
Click for Watch Lists
Click for Current Positions
Click for Closed Positions
Updated Top 100 List Dec 1, 2023
Dividend Growth Portfolio
Updated ETF Sector Rotation System
Dogs of the DOW System
Long Term Strategy for IRAs & 401k Plans
CNN Fear & Greed Index
Scrolling Stage Chart Investing Charts
Alert! Market Risk is High (RED). The probability of successful Short Term Trades is better, when the % of stocks above the 50-day avg. is below 20.
Tell your Friends about the Green Line, and Help Animals.
______________________________________________________________________________
5 Ways to Get your Daily Money Wave Email Alert:
-
- Emailed to your box between 3:45 – 3:50 pm EST.
- Website menu Commentary/Buy/Sell Signals
- Discord Chat. and X (Twitter) @AboveGreenLine mobile notifications are the fastest (please set up “mobile notifications”)
- Text messages: Email us your Cell number & phone carrier.
Thank you,
ATGL
Related Post
– AFRM


