
5/21/2023 Markets were sharply higher this week, as the Big Tech & Semiconductor made higher highs. Investors are betting that the FED Tightening (raising short term Interest Rates) is over. The Markets are going up and discounting the Good News of no more FED Tightening soon. In October the Markets dropped sharply on high Inflation (Bad News), so Smart Money bought Stocks low. What did you do?
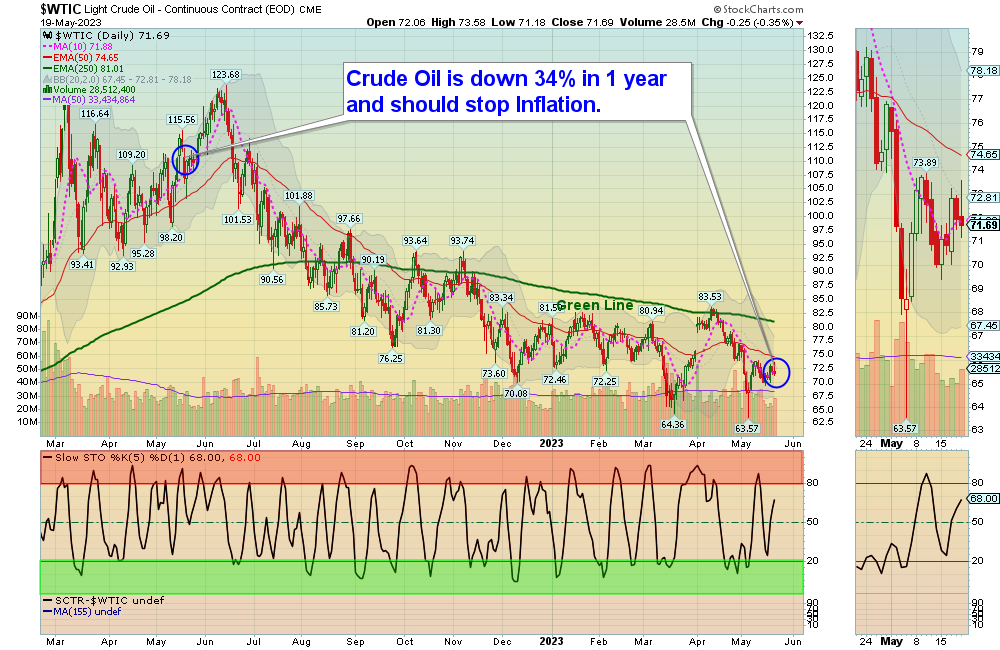
The FED has raised rates up to 5% and that is slowing down the world Economy. Crude Oil is down 34% since last May, and soon the lagging Inflation numbers should drop, maybe even going negative later this year. The Markets will be should be elated seeing Inflation Fears go away. But the low Buying Volume on this rally tells us that something is wrong, as Buying and narrow Market Breadth is a warning sign. Maybe Smart Money is taking profits now.
The Strong companies that are growing quickly are doing fine, but most are extremely over bought. And many weak Stocks that are Below the Green Line are still getting crushed.
The S&P 500 is trying to Close above Resistance of 4195, and needs to exceed that for more Market upside. But the FEAR Index (VIX) is under $17, telling us that Dumb Money is now panic Buying call options (expecting a huge rally).
We will continue to Buy strong investments on pull-backs, and not worry about it. Low Volume is our only concern.
If you continue to Follow the Green Line System, your Money should flow into the Strongest areas and your account value should be able to grow in both Bull and Bear Markets. Follow the MONEY, not the MEDIA.
_____________________________________________________________________________________________
For the week the Dow was up 0.51%, the S&P 500 was up 1.71% and the NASDAQ 100 was up 3.53%. Many of the major Indices still have a Relative Strength below 80, so you should currently own the stronger Securities here.
The Inflation Index (CRB) was up 1.63% for the week and is Below the Green Line, indicating Economic Contraction.
Bonds were down 3.04% for the week, and are Below the Green Line, indicating Economic Expansion.
The US DOLLAR was up 0.56% for the week and is Below the Green Line.
Crude Oil was up 2.36% for the week at $71.69 and GOLD was down 1.89% at $1981.60.
We are now doing micro Day Trades on our new Discord site (free), and now have 225 members. Please join for mobile notifications during the day. Other methods of notification have been too Slow. Also, please check our our Live Streaming on YouTube during Market hours.
More action this week on the Day Trading Scrolling Charts, and DAY TRADING CHARTS FOR INDICES & LARGE CAPS.
_____________________________________________________________________________________________
MONEY BUYS SOON:
We are in now in 7 logged Swing Trading Positions for the Short & Medium Term. There are 5 investments on the Short Term Watch List.
Be patient and WAIT for Green Zone Buy Signals!
LONG TERM INVESTMENTS:
Long Term Scrolling Charts (Real Time)
EDU ORIENTAL EDUCATION GROUP Buy above $46.63 with High Volume with a 3% Trailing Sell Stop Loss below it.
PINS PINTEREST INC. Buy above $29.27 with High Volume with a 3% Trailing Sell Stop Loss below it.
SH INVERSE S&P 500 FUND Buy above $17.71 with High Volume with a 3% Trailing Sell Stop Loss below it.
SHOP SHOPIFY INC. Bought on the Daily Money Wave Buy Signal at $60.85. Target is $95, Sell Stop below the Green Line.
STLD STEEL DYNAMICS INC. Buy above $105.85 with High Volume with a 3% Trailing Sell Stop Loss below it.
STNE STONECO LTD. Buy above $15.01 with High Volume with a 3% Trailing Sell Stop Loss below it.
TAL TAL EDUCATION GROUP Buy above $10.45 with High Volume with a 3% Trailing Sell Stop Loss below it.
__________________________________________________________________________________________
My Trading Dashboard
Swing Trading Scrolling Charts
Day Trading Scrolling Charts
Click for Watch Lists
Click for Current Positions
Click for Closed Positions
Updated Top 100 List May 1, 2023
Dividend Growth Portfolio
Updated ETF Sector Rotation System
Dogs of the DOW System
Long Term Strategy for IRAs & 401k Plans
CNN Fear & Greed Index
Scrolling Stage Chart Investing Charts
Alert! Market Risk is Medium (YELLOW). The probability of successful Short Term Trades is better, when the % of stocks above the 50-day avg. is below 20.
Tell your Friends about the Green Line, and Help Animals.
________________________________________________________________________________
QUESTION: Jose M writes “Morning, I seem to have difficulties on finding the Money Wave chart on the ETFs. Thanks.”
ANSWER: First go to MY TRADING DASH BOARD. Then the Charts with the Money Waves can be pulled up by clicking on the Symbol of the Investment on the Watch List or Current Positions links in every Daily email.
The Money Wave is the Red and Green Zone on the bottom part of the Chart. Buy when the Money Wave has gone down into the Green Zone, and then turns up above 20.
Related Post
– EDU


