
2/12/2023 Markets were lower for the week as Treasury Bond prices rolled over, which caused long term Interest Rates to rise. Long term Interest Rates have dropped steadily from the November high of 4.42% down towards the Green Line of 3.41% (18% drop), but the upward momentum is pushing rates higher again. We bought the Inverse T-Bond Fund (TBT) as it should go up again with higher long term Interest Rates. Maybe the massive spending by Congress ($1.7 TRILION recently) is the new “sugar high”, and Steel and Copper have been strong recently.
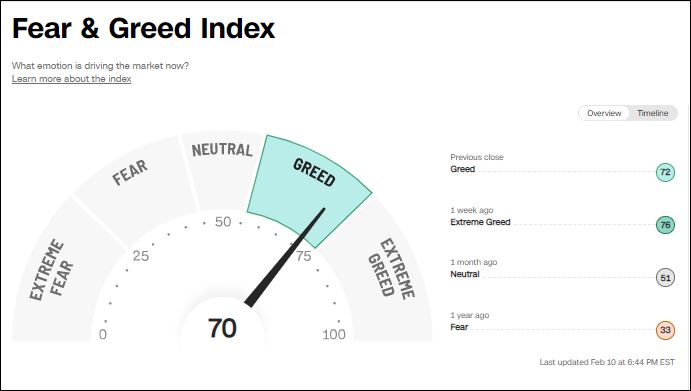
The major Stock Indices are all back Above the Green Lines, but became very over bought for the short term (CNN Fear & Greed Index hit 76). Markets reached a panic buying stage on FOMO (Fear of missing Out & Greed).
If you continue to Follow the Green Line System, your Money should flow into the Strongest areas and your account value should be able to grow in both Bull and Bear Markets. Follow the MONEY, not the MEDIA..
______________________________________________________________________________________________________________________________________________
For the week the Dow was down 0.07%, the S&P 500 was down 1.05% and the NASDAQ 100 was down 2.12%. Most of the major Indices do not have Relative Strength above 80, so you should currently own the stronger Securities here.
The Inflation Index (CRB) was up 2.43% for the week and is Below the Green Line, indicating Economic Contraction.
Bonds were down 3.10% for the week, and are Below the Green Line, indicating Economic Expansion.
The US DOLLAR was up 0.78% for the week and is Above the Green Line.
Crude Oil was up 8.63% for the week at $79.72 and GOLD was down 0.11% at $18.74.50.
More action this week on the Day Trading Scrolling Charts. and Live Streaming.
DAY TRADING CHARTS FOR INDICES & LARGE CAPS.
We have not had many intra-day Trade Alert signals lately as the Volume has been too Low with the Buy Signals (FED is still tightening). These low Volume Buy Signals tend to pop up and quickly fade back down. We like to see High Volume on rallies. Please check our our Live Streaming during Market hours.
_____________________________________________________________________________________________
MONEY WAVE BUYS SOON:
We are in now in 5 logged Swing Trading Positions for the Short & Medium Term. There are 7 investments on the Short Term Watch List.
Be patient and WAIT for Green Zone Buy Signals!
LONG TERM INVESTMENTS: (It is still hard to find many Long Term now because most normal Investments no longer have 80 Relative Strength required.)
Long Term Scrolling Charts (Real Time)
CHWY CHEWY INC. Buy above $52.88 with High Volume with a 3% Trailing Sell Stop Loss below it.
GIS GENERAL MILLS INC. Wait for Weekly Money Wave Close > 20 with High Volume.
SH INVERSE S&P 500 FUND Buy above $17.71 with High Volume with a 3% Trailing Sell Stop Loss below it.
TBT INVERSE T-BOND FUND (2X) Bought above $28.98. Target is $32.50. EXIT if it is going to Close below the Green Line of $27.29.
TWNK HOSTESS BRANDS Buy above $23.49 with High Volume with a 3% Trailing Sell Stop Loss below it.
VIPS VIPSHOP HOLDINGS Buy on the next Daily Money Wave Buy Signal.
______________________________________________________________________________________________________
My Trading Dashboard
Swing Trading Scrolling Charts
Day Trading Scrolling Charts
Click for Watch Lists
Click for Current Positions
Click for Closed Positions
Updated Top 100 List Feb 1, 2023
Dividend Growth Portfolio
Updated ETF Sector Rotation System
Dogs of the DOW System
Long Term Strategy for IRAs & 401k Plans
CNN Fear & Greed Index
Scrolling Stage Chart Investing Charts
Alert! Market Risk is High (RED). The probability of successful Short Term Trades is better, when the % of stocks above the 50-day avg. is below 20.
Tell your Friends about the Green Line, and Help Animals.
________________________________________________________________________________
QUESTION: Jose M writes “Morning, I seem to have difficulties on finding the Money Wave chart on the ETFs. Thanks.”
ANSWER: The Charts and Money Waves can be pulled up by clicking on the Symbol of the Investment on the Watch List or Current Positions links in every Daily email.
The Money Wave is the Red and Green Zone on the bottom part of the Chart. Buy when the Money Wave has gone down into the Green Zone, and then turns up above 20.
Related Post
– GIS


