Above the Green Line -01
  • Market Insights
        • Commentary
          • Daily
          • Weekly
        • BUY / SELL SIGNALS
          • Trade Posts
          • Recent Trade Alerts
          • Recent Day Trades
        • BLOGROLL
          • Dividend Growth Blog
          • ETF Sector Blog
          • Dow Dogs
          • TPOW Blog
  • Strategies
        • SWING TRADING
          • Current Positions
          • Watchlists
          • Closed Positions
          • Candidates - TOP 100
          • Specialty Stocks
        • WEEKLY STOCK PICK
          • TPOW Charts
          • TPOW Performance
          • TPOW Strategy Guide
          • TPOW Performance Dashboard
        • DAY TRADING
          • Watch List
        • ATGL DASHBOARD
        • ETF STRATEGIES
          • ETF Sector Rotation
          • ETF Sector Portfolio
        • DIVIDEND GROWTH
          • Dividend Growth Portfolio
          • Dividend Calendar
        • DOGS OF THE DOW
          • Dogs of the Dow Portfolio
          • DOW 5 Portfolio
  • Markets
        • US MARKET
          • Commodities
          • Energy
          • Precious Metals
          • Volatility
        • GLOBAL MARKETS
          • Market Indices
          • Economic Calendar
          • FOREX Heat Map
          • FOREX Cross Rates
          • Crypto Currency Market
  • Investing
    • Discord Community
    • Dashboard
  • Resources
        • ARTICLES
          • Dividend Growth Model Articles
          • ETF Articles
          • Investment Strategies Articles
          • Market and Economic Insights
          • Stock Trade Articles
          • Stock Reviews
        • TOOLS
          • Stock Scanners
          • Charting Software
          • Brokerage Firms
        • STOCK CHARTS
          • Key Components
          • Reading Charts
          • Drawing Stock Charts
          • Identifying Trends
        • RETIREMENT PLANNING
  • About
    • Contact Us
    • How to Win
    • #1 At Stockcharts
    • Disclaimer
    • FAQ
  • Log In
  • Subscribe

January 16, 2022

Green Line Weekly Jan 16, 2022

QQQ Chart
Possible 5 Wave Elliott Wave Count for the NASDAQ 100 Fund (QQQ).

1/16/2022 Markets were slightly lower for the week. The Markets tried to rally from Monday’s Low, but there was very Low Volume as the Buyers did not come in. Then on Friday the Markets went back down to re-test the recent Lows. So the Bulls are hoping for a “W” Pattern back up soon, on Higher Volume.

If good Buying does not come in soon, then the Markets might have to drop to a lower level to bring in more buying from Smart Money. Smart Money is being very cautious, since the FED Printing and Tapering should reduce the amount of liquidity in the Markets.

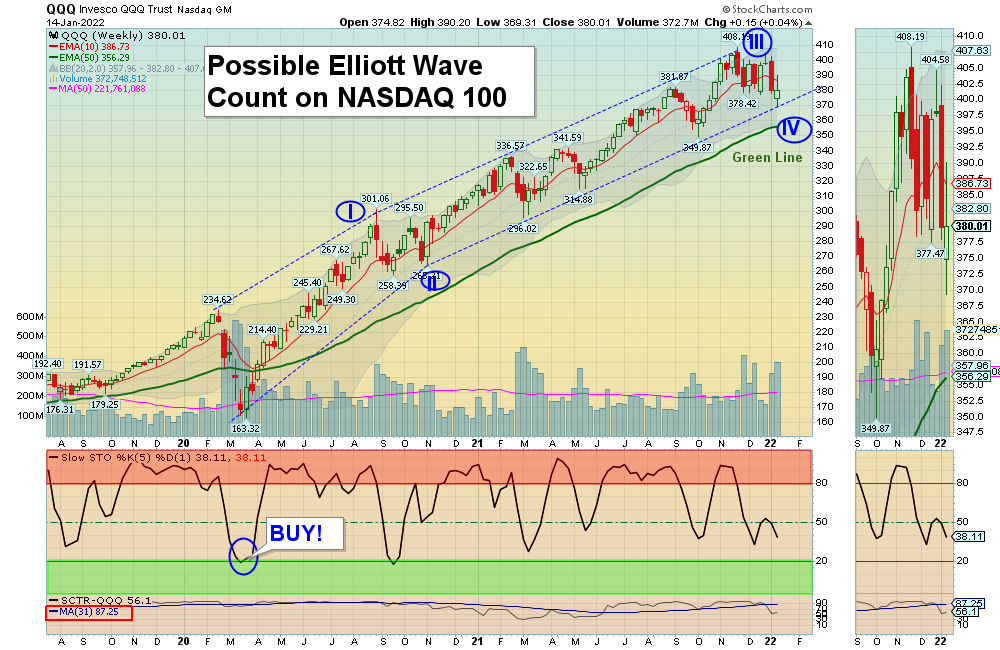
If you continue to Follow the Green Line System, your Money should flow into the Strongest areas and your account value should be able to grow in both Bull and Bear Markets.     

There has been plenty of action on the Day Trading Scrolling Charts.  

NEW! DAY TRADING CHARTS FOR INDICES & LARGE CAPS.

We have not had many intra-day Stocks Alerts lately as the Volume has been too Low on Buy Signals. We like to see High Volume on rallies.

For the week the Dow was down 0.87%, the S&P 500 was down 0.29%, and the NASDAQ 100 was up 0.04%. The Long Term Trend for the Indices is up. 

The Inflation Index (CRB) was up 3.17% for the week (a New High) and is Above the Green Line, indicating Economic Expansion.

Bonds were down 0.11% for the week, and are Below the Green Line, indicating Economic Expansion.

The US DOLLAR was down 0.59% for the week and is Above the Green Line. 

Crude Oil was up 6.24% for the week at $83.82 and GOLD was up 1.06%  at $1816.50. 

SEE SUPPLEMENTAL CHARTS

_____________________________________________________________________________________________

MONEY WAVE BUYS SOON

We are only in 3 logged Current Positions, for the Short & Medium Term.  There are 4 investments on the Short Term Watch List. 

Be patient and WAIT for Green Zone Buy Signals!

_________________________________________________________________________________________

LONG TERM INVESTMENTS  (many Large Caps no longer have 80 Relative Strength required.)

Long Term Scrolling Charts (Real Time)   

BX      BLACKSTONE GROUP      Buy if it Closes above $124.39 with High Volume.   

CROX      CROCS INC.      Buy if it Closes above $136.81 with High Volume.     

DKS      DICKS SPORTING GOODS      Buy if it Closes above $118.25 with High Volume.

LC      LENDING CLUB CORP.      Buy if it Closes above $27.92 with High Volume. 

RRC      RANGE RESOURCES      Bought on the Close above $19.76, and it shot up 16.46% this week.

________________________________________________________________________________

My Trading Dashboard
Swing Trading Scrolling Charts
Day Trading Scrolling Charts

Click for  Watch Lists
Click for  Current Positions
Click for  Closed Positions

Updated Top 100 List Jan 1, 2022
Dividend Growth Portfolio  
ETF Sector Rotation System      
Dogs of the DOW System
Long Term Strategy for IRAs & 401k Plans
CNN Fear & Greed Index
Scrolling Stage Chart Investing Charts

Alert! Market Risk is MEDIUM (Yellow Zone). The probability of successful Short Term Trades is better, when the % of stocks above the 50-day avg. is below 20. 

Tell your Friends about the Green Line, and Help Animals.

________________________________________________________________________________ 

QUESTION: Steve V. writes “Do you do both long and short positions or does someone just invert the rules in a down market?”

ANSWER:  Yes, invert the Rules to Sell Short (Below the G L, Below 10 R S, Dropping below 80 on the Money Wave).

We will wait until the Market is in a Bear (below the Green Line), and not Short the next Correction back down to Green Line.

Once the Market is BEAR, we will mainly do Inverse Funds, as most investors don’t understand Shorting…

The Leaders should have nice pops up if they hold above the G L after the next Correction, and we don’t like to Sail into the Wind.

Good trading and tell your friends!

ATGL

Related Post

– Green Line Weekly Jan 9, 2022

Subscribe to Our Newsletter

AGL Logo

Get our eBook Now!

Candlestick - A Swing Traders Friend

We don’t spam! Read our privacy policy for more info.

You’ve been successfully subscribed to our newsletter!

Voted #1 at Stock Charts

SH Chart
Inverse S&P 500 Fund (SH) will have a Money Wave Buy today.

Help Us Help Animals

Help Us Help Animals

Recent Comments

  • Market Breadth Indicators: A Trader’s Guide to Early Trend Detection on Backtesting: Definition and How a Trading Strategy Backtest Works
  • Island Reversal Pattern: Definition and Formation Explained on Double Top Pattern: How to Identify and Trade This Reversal Signal
  • Channel Pattern Guide: What It Is and Why It Matters on A Guide to Forecasting Using Moving Averages
  • What Is a Broadening Bottom Chart Pattern? Full Guide on Bull vs. Bear Market: An Investor’s Guide to Market Phases
  • ATGL Weekly Money Flow - 2025-05-11 on ATGL Top Pick of the Week! Apr 6, 2025

Become a Green Liner!

Help me make more Money in the Stock Market.

ON ATGL

  • DashBoard
  • Weekly Commentary
  • Daily Buy / Sell Signals
  • Day Trade Setup
  • Trading Rooms

Design & Develop By Pixelvect

STRATEGIES

  • Swing Trading
  • ATGL Pick of the Week
  • Dividend Growth
  • ETF Sector Rotation
  • Dogs of the Dow

HELP

  • ATGL Trading Rules
  • FAQ
  • Account Maintenance
  • Contact US
  • Join

FOLLOW US

Instagram Linkedin Twitter Facebook

© COPYRIGHT 2024 · ABOVETHEGREENLINE.COM · ALL RIGHTS RESERVED · PRIVACY · TERMS · CONTACT · WATCHLIST · CURRENT