
10/17/2021 Markets were higher again this week, as the major Indices are going back up to retest the September Highs. However, the Buying Volume was still below average, and Commodity Prices made New Highs for the week. Stocks now have some competition from Commodity Prices and Inflation (Tangible Investments). Now the Indices need to make New Highs for the rally since the March 2020 Lows to continue.
Don’t let the Media talk you into holding on to inferior Investments that are now Below the Green Lines. Please adjust your portfolio to always own Investments that are Above the Green Line, even if you are not familiar with these Investments. We want you to own Investments with High Volume and High Relative Strength, only. Follow the Smart Money.
If you continue to Follow the Green Line System, your Money should flow into the Strongest areas and your account value should be able to grow in both Bull and Bear Markets.
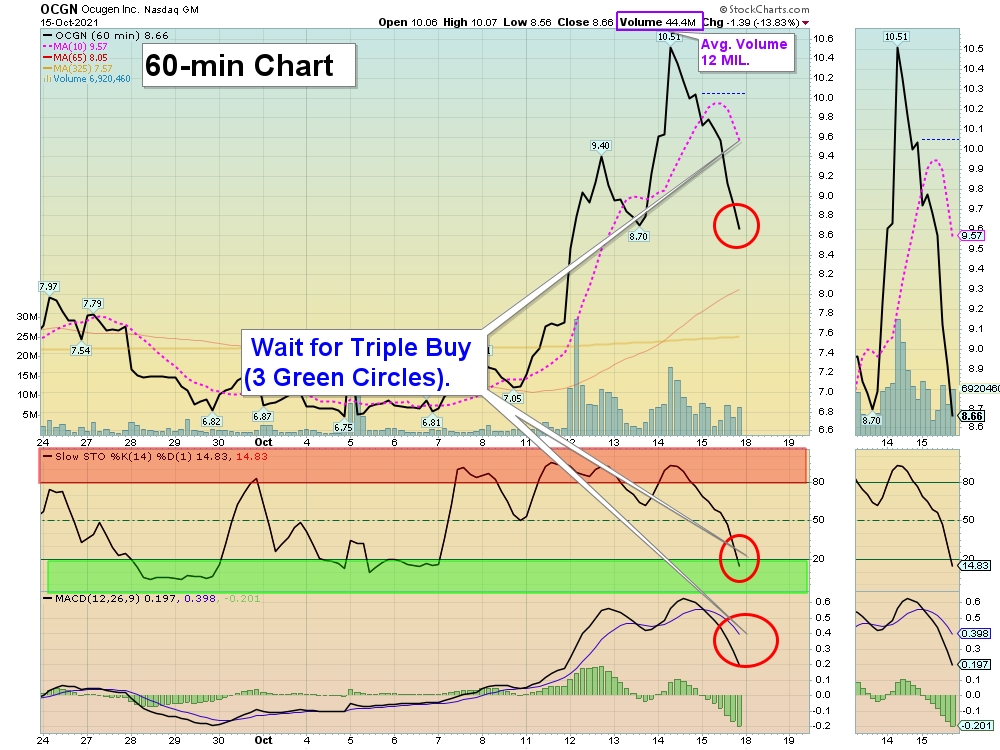
Please take a look at the new “Triple Buy” Day Trading System.
Scroll thru the Charts with Red Circles and WAIT for them to change to 3 Green Circles.
Then BUY immediately! EXIT if the Stock falls below the Pink Dotted Line (10-hour average). Works best when the Volume is High.
Day Trading Charts are here. Keep Refreshing the page for updated “Real Time” Charts.
The 3 Green Circles create a “Triple Buy” Signal. Learn more about “Triple Buys”.
This System requires some time from you during the day, and the moves can be very quick if the Volume picks up. Several Investment Software Platforms like Think or Swim (free with Ameritrade) offer Paper Trading so you can test the System for yourself.
We finally had some Swing Trades hit their Targets this week:
AA ALCOA CORP Target Hit at $52 for a 10 % Gain.
ANY SPHERE 3D Target Hit at $8 for a 29 % Gain.
BBIG VINCO VENTURES Buy Stop trade for a 9.57 % Gain.
BBIG VINCO VENTURES Target Hit at $9 for a 28.9 % Gain.
CCJ CAMECO CORP. Target Hit at $24.50 for a 16.9 % Gain.
For the week the Dow was up 1.56%, the S&P 500 was up 1.83%, and the NASDAQ 100 was up 2.15%. The Long Term Trend for the Indices is up.
The Inflation Index (CRB) was up 1.64% for the week (a New High) and is Above the Green Line, indicating Economic Expansion.
Bonds were up 2.22% for the week, and are back Below the Green Line, indicating Economic Expansion.
The US DOLLAR was down 0.15% for the week and is Above the Green Line.
Crude Oil was up 3.00% for the week at $81.73 and GOLD was up 0.62% at $1768.30.
_____________________________________________________________________________________________
MONEY WAVE BUYS SOON
We are currently in only 2 logged Current Positions, for the Short & Medium Term (we captured 5 Gains this week. There are 5 investments on the Short Term Watch List.
Be patient and WAIT for Green Zone Buy Signals!
______________________________________________________________________________________________
LONG TERM INVESTMENTS (A few Leaders have pulled back , but most Large Caps no longer have 80 Relative Strength required.)
Long Term Scrolling Charts (Real Time)
BNTX BIO N TECH Wait for the next Daily Money Wave Buy Signal.
CLF CLEVELAND-CLIFFS INC. Buy if it Closes above the Red Line (50-day avg.) with High Volume.
DKS DICKS SPORTING GOODS Wait for the next Daily Money Wave Buy Signal.
MT ARCELOR METTAL SA Up 11 % this week. Wait for the next Daily Money Wave Buy Signal.
MGI MONEYGRAM INT’L. Buy if it Closes above the Red Line (50-day avg.) with High Volume.
MRNA MODERNA INC. Wait for the next Daily Money Wave Buy Signal.
YETI YETI HOLDINGS Wait for the next Daily Money Wave Buy Signal.
______________________________________________________________________________________
My Trading Dashboard
Swing Trading Scrolling Charts
Day Trading Scrolling Charts
Click for Watch Lists
Click for Current Positions
Click for Closed Positions
Updated Top 100 List Oct 1, 2021
Dividend Growth Portfolio
ETF Sector Rotation System
Dogs of the DOW System
Long Term Strategy for IRAs & 401k Plans
CNN Fear & Greed Index
Scrolling Stage Chart Investing Charts
Alert! Market Risk is MEDIUM (Yellow Zone). The probability of successful Short Term Trades is better, when the % of stocks above the 50-day avg. is below 20.
Tell your Friends about the Green Line, and Help Animals.
______________________________________________________________________________________
QUESTION: Winter writes ““Don’t take a Loss” confuses me. What does that mean?”
ANSWER: When the Investment has a Money Wave Buy Signal, it should pop up 3-6 % in just a few days.
If it is not popping up well, and the Money Wave > 50, either Get out, or Don’t Take a Loss!
Something must be Wrong. There will be plenty more… Raise Cash, and don’t get Stuck! Wait for the next one.
Good trading and tell your friends!
ATGL


