Above the Green Line -01
  • Market Insights
        • Commentary
          • Daily
          • Weekly
        • BUY / SELL SIGNALS
          • Trade Posts
          • Recent Trade Alerts
          • Recent Day Trades
        • BLOGROLL
          • Dividend Growth Blog
          • ETF Sector Blog
          • Dow Dogs
          • TPOW Blog
  • Strategies
        • SWING TRADING
          • Current Positions
          • Watchlists
          • Closed Positions
          • Candidates - TOP 100
          • Specialty Stocks
        • WEEKLY STOCK PICK
          • TPOW Charts
          • TPOW Performance
          • TPOW Strategy Guide
          • TPOW Performance Dashboard
        • DAY TRADING
          • Watch List
        • ATGL DASHBOARD
        • ETF STRATEGIES
          • ETF Sector Rotation
          • ETF Sector Portfolio
        • DIVIDEND GROWTH
          • Dividend Growth Portfolio
          • Dividend Calendar
        • DOGS OF THE DOW
          • Dogs of the Dow Portfolio
          • DOW 5 Portfolio
  • Markets
        • US MARKET
          • Commodities
          • Energy
          • Precious Metals
          • Volatility
        • GLOBAL MARKETS
          • Market Indices
          • Economic Calendar
          • FOREX Heat Map
          • FOREX Cross Rates
          • Crypto Currency Market
  • Investing
    • Discord Community
    • Dashboard
  • Resources
        • ARTICLES
          • Dividend Growth Model Articles
          • ETF Articles
          • Investment Strategies Articles
          • Market and Economic Insights
          • Stock Trade Articles
          • Stock Reviews
        • TOOLS
          • Stock Scanners
          • Charting Software
          • Brokerage Firms
        • STOCK CHARTS
          • Key Components
          • Reading Charts
          • Drawing Stock Charts
          • Identifying Trends
        • RETIREMENT PLANNING
  • About
    • Contact Us
    • How to Win
    • #1 At Stockcharts
    • Disclaimer
    • FAQ
  • Log In
  • Subscribe

October 10, 2021

Green Line Weekly Oct 10, 2021

WTIC Chart
Crude Oil Made a New High this week at $80.

10/10/2021 Markets were higher this week, as the major Indices bounced up from being over-sold for the Short Term. Many Leaders popped up out of the Green Zones (probably too late to Sell for the Short Term) for Money Wave Buys. However, the Buying Volume was still below average. Now the Indices need to make New Highs for the rally since the March 2020 Lows to continue.

Stocks now have some competition as Long Term Bonds fell more (higher Interest Rates) and Commodity Prices made New Highs again this week. Adjust your portfolio to always own Investments that are Above the Green Line, even if you are not familiar with these Investments. We want to own Investments with High Volume and High Relative Strength. Follow the Smart Money.

Don’t let the Media talk you into holding on to inferior Investments that are Below the Green Lines.

If you continue to Follow the Green Line System, your Money should flow into the Strongest areas and your account value should be able to  grow in both Bull and Bear Markets. 

For the week the Dow was up 1.27%, the S&P 500 was up 0.83%, and the NASDAQ 100 was up 0.27%. The Long Term Trend for the Indices is up. 

The Inflation Index (CRB) was up 2.19% for the week (a New High) and is Above the Green Line, indicating Economic Expansion.

Bonds were down 2.39% for the week, and are back Below the Green Line, indicating Economic Expansion.

The US DOLLAR was up 0.03% for the week and is Above the Green Line. 

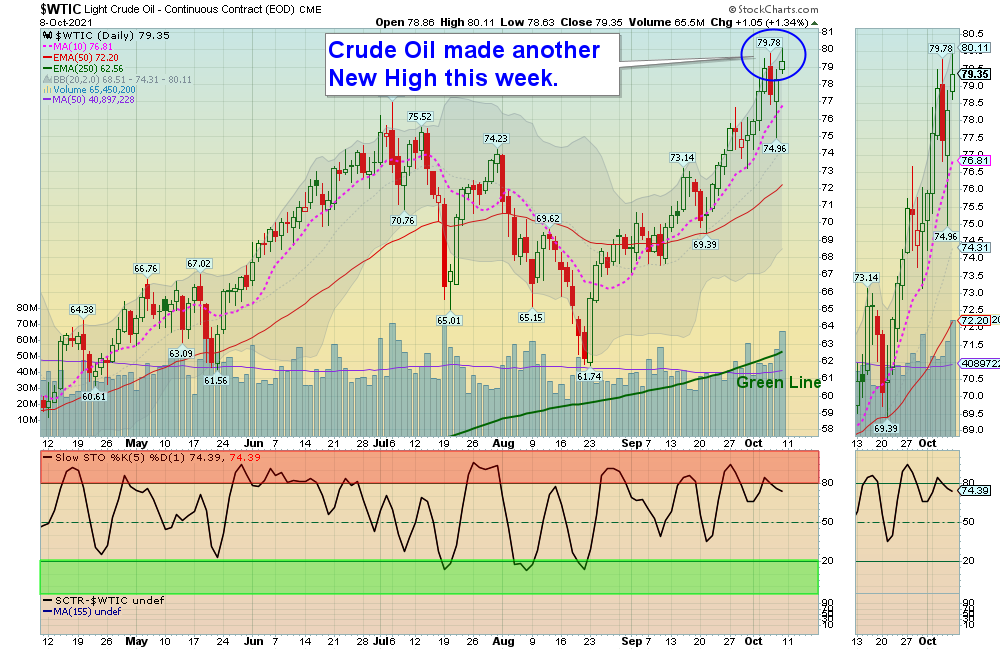
Crude Oil was up 4.57% for the week at $79.35 and GOLD was down 0.06%  at $1757.40.

SEE SUPPLEMENTAL CHARTS

_____________________________________________________________________________________________

MONEY WAVE BUYS SOON

We are currently in 5 logged Current Positions, for the Short & Medium Term.  There are 6 investments on the Short Term Watch List. 

Be patient and WAIT for Green Zone Buy Signals!

______________________________________________________________________________________________

LONG TERM INVESTMENTS  (A few Leaders have pulled back , but most Large Caps no longer have 80 Relative Strength required.)

Long Term Scrolling Charts (Real Time)

BNTX      BIO N TECH      Wait for the next Daily Money Wave Buy Signal.

CLF      CLEVELAND-CLIFFS INC.      Buy if it Closes above the Red Line (50-day avg.) with High Volume.       

MT      ARCELOR METTAL SA      Wait for the next Daily Money Wave Buy Signal.

MGI      MONEYGRAM INT’L.    Buy if it Closes above the Red Line (50-day avg.) with High Volume.   

XLRE      REAL ESTATE FUND       Wait for the next Daily Money Wave Buy Signal.

YETI      YETI HOLDINGS       Wait for the next Daily Money Wave Buy Signal.

______________________________________________________________________________________

My Trading Dashboard
Swing Trading Scrolling Charts
Day Trading Scrolling Charts

Click for  Watch Lists
Click for  Current Positions
Click for  Closed Positions

Updated Top 100 List Oct 1, 2021
Dividend Growth Portfolio  
ETF Sector Rotation System      
Dogs of the DOW System
Long Term Strategy for IRAs & 401k Plans
CNN Fear & Greed Index
Scrolling Stage Chart Investing Charts

Alert! Market Risk is MEDIUM (Yellow Zone). The probability of successful Short Term Trades is better, when the % of stocks above the 50-day avg. is below 20. 

Tell your Friends about the Green Line, and Help Animals.

______________________________________________________________________________________     

QUESTION:  Jose M writes “Morning, I seem to have difficulties on finding the Money Wave chart on the ETFs. Thanks.”

ANSWER:  First go to MY TRADING DASH BOARD.  Then the Charts with the Money Waves can be pulled up by clicking on the Symbol of the Investment on the  Watch List  or Current Positions links in every Daily email.

The Money Wave is the Red and Green Zone on the bottom part of the Chart. Buy when the Money Wave has gone down into the Green Zone, and then turns up above 20. 

Related Post

– Green Line Weekly Oct 3, 2021

Subscribe to Our Newsletter

AGL Logo

Get our eBook Now!

Candlestick - A Swing Traders Friend

We don’t spam! Read our privacy policy for more info.

You’ve been successfully subscribed to our newsletter!

Voted #1 at Stock Charts

SH Chart
Inverse S&P 500 Fund (SH) will have a Money Wave Buy today.

Help Us Help Animals

Help Us Help Animals

Recent Comments

  • Market Breadth Indicators: A Trader’s Guide to Early Trend Detection on Backtesting: Definition and How a Trading Strategy Backtest Works
  • Island Reversal Pattern: Definition and Formation Explained on Double Top Pattern: How to Identify and Trade This Reversal Signal
  • Channel Pattern Guide: What It Is and Why It Matters on A Guide to Forecasting Using Moving Averages
  • What Is a Broadening Bottom Chart Pattern? Full Guide on Bull vs. Bear Market: An Investor’s Guide to Market Phases
  • ATGL Weekly Money Flow - 2025-05-11 on ATGL Top Pick of the Week! Apr 6, 2025

Become a Green Liner!

Help me make more Money in the Stock Market.

ON ATGL

  • DashBoard
  • Weekly Commentary
  • Daily Buy / Sell Signals
  • Day Trade Setup
  • Trading Rooms

Design & Develop By Pixelvect

STRATEGIES

  • Swing Trading
  • ATGL Pick of the Week
  • Dividend Growth
  • ETF Sector Rotation
  • Dogs of the Dow

HELP

  • ATGL Trading Rules
  • FAQ
  • Account Maintenance
  • Contact US
  • Join

FOLLOW US

Instagram Linkedin Twitter Facebook

© COPYRIGHT 2024 · ABOVETHEGREENLINE.COM · ALL RIGHTS RESERVED · PRIVACY · TERMS · CONTACT · WATCHLIST · CURRENT