
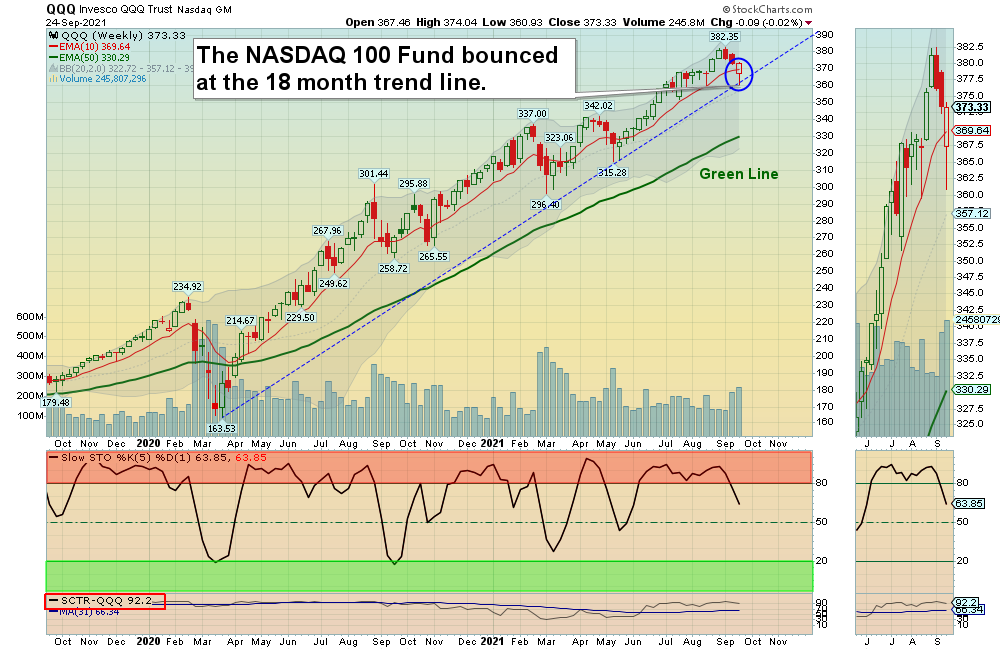
9/26/2021 Markets were slightly higher this week, as the Indices bounced up out of the Green Zones for Money Wave Buy Signals. It is disappointing that the Volume has not improved on the latest bounce up, showing a lack of good Buying. The Markets should be able to re-test the recent Highs, and must continue to make Higher Highs for this 18 month rally to continue.
Not much has been changing, unless Long Term Bonds were to fall Below the Green Line. This could happen with higher Interest Rates and Inflation. But if you continue to Follow the Green Line System, your Money should flow into the Strongest areas and your account value should be able to grow in both Bull and Bear Markets.
Most of our success lately has been using Triple Buy Signals on the Day Trading Scrolling Charts. Most trades have happened early in the morning.
We will have a Quarterly Rotation on Thursday Sep 30 for the ETF Sector Rotation System.
For the week the Dow was up 0.65%, the S&P 500 was up 0.57%, and the NASDAQ 100 was down 0.02 %. The Long Term Trend for the Indices is up.
The Inflation Index (CRB) was up 1.44% for the week (a New High) and is Above the Green Line, indicating Economic Expansion.
Bonds were down 1.52% for the week, and are Above the Green Line, indicating Economic Contraction.
The US DOLLAR was up 0.17% for the week and is Above the Green Line.
Crude Oil was up 3.01% for the week at $73.98 and GOLD was up 0.02% at $1751.70.
_____________________________________________________________________________________________
MONEY WAVE BUYS SOON
We are currently in only 2 logged Current Positions, for the Short & Medium Term. There are 6 investments on the Short Term Watch List.
Be patient and WAIT for Green Zone Buy Signals!
______________________________________________________________________________________________
LONG TERM INVESTMENTS (Some Leaders have pulled back , but Markets are near Highs.)
Long Term Scrolling Charts (Real Time)
CLF CLEVELAND-CLIFFS INC. Buy if it Closes above the Red Line (50-day avg.) with High Volume.
EYES SECOND SIGHT MEDICAL Buy if it Closes above the Green Line (250-day avg.) with High Volume.
F FORD MOTOR CO. Closed above the Red Line (50-day avg.) again this week Higher Volume.
KOPN KOPIN CORP. Buy if it Closes above the Red Line (50-day avg.) with High Volume.
MGI MONEYGRAM INT’L. Buy if it Closes above the Red Line (50-day avg.) with High Volume.
PRTY PARTY CITY INC. Popped up 12 % this week. Volume was not High, though.
______________________________________________________________________________________
My Trading Dashboard
Swing Trading Scrolling Charts
Day Trading Scrolling Charts
Click for Watch Lists
Click for Current Positions
Click for Closed Positions
Updated Top 100 List Sep 1, 2021
Dividend Growth Portfolio
ETF Sector Rotation System
Dogs of the DOW System
Long Term Strategy for IRAs & 401k Plans
CNN Fear & Greed Index
Scrolling Stage Chart Investing Charts
Alert! Market Risk is MEDIUM (Yellow Zone). The probability of successful Short Term Trades is better, when the % of stocks above the 50-day avg. is below 20.
Tell your Friends about the Green Line, and Help Animals.
______________________________________________________________________________________
QUESTION: Kinch writes “I am only receiving a notification about the market about 10 minutes before the market closes. I never get a text message about any trades. Is this the way it works?”
ANSWER: Hi Kinch. Most subscribers do best with the End of Day Swing Trading (email arrives just before the Market Close).
We do send out Day Trade Alerts by Twitter, if you want to set up a free Twitter account. These Alerts are also on the Main Menu: Stock Alerts
For Twitter, please install the app on your cell, and set up mobile notifications:
Please Follow Us @AboveGreenLine on Twitter and click on the bell icon to set up mobile notifications.
Thanks for writing,
ATGL


