Above the Green Line -01
  • Market Insights
        • Commentary
          • Daily
          • Weekly
        • BUY / SELL SIGNALS
          • Trade Posts
          • Recent Trade Alerts
          • Recent Day Trades
        • BLOGROLL
          • Dividend Growth Blog
          • ETF Sector Blog
          • Dow Dogs
          • TPOW Blog
  • Strategies
        • SWING TRADING
          • Current Positions
          • Watchlists
          • Closed Positions
          • Candidates - TOP 100
          • Specialty Stocks
        • WEEKLY STOCK PICK
          • TPOW Charts
          • TPOW Performance
          • TPOW Strategy Guide
          • TPOW Performance Dashboard
        • DAY TRADING
          • Watch List
        • ATGL DASHBOARD
        • ETF STRATEGIES
          • ETF Sector Rotation
          • ETF Sector Portfolio
        • DIVIDEND GROWTH
          • Dividend Growth Portfolio
          • Dividend Calendar
        • DOGS OF THE DOW
          • Dogs of the Dow Portfolio
          • DOW 5 Portfolio
  • Markets
        • US MARKET
          • Commodities
          • Energy
          • Precious Metals
          • Volatility
        • GLOBAL MARKETS
          • Market Indices
          • Economic Calendar
          • FOREX Heat Map
          • FOREX Cross Rates
          • Crypto Currency Market
  • Investing
    • Discord Community
    • Dashboard
  • Resources
        • ARTICLES
          • Dividend Growth Model Articles
          • ETF Articles
          • Investment Strategies Articles
          • Market and Economic Insights
          • Stock Trade Articles
          • Stock Reviews
        • TOOLS
          • Stock Scanners
          • Charting Software
          • Brokerage Firms
        • STOCK CHARTS
          • Key Components
          • Reading Charts
          • Drawing Stock Charts
          • Identifying Trends
        • RETIREMENT PLANNING
  • About
    • Contact Us
    • How to Win
    • #1 At Stockcharts
    • Disclaimer
    • FAQ
  • Log In
  • Subscribe

December 27, 2020

Green Line Weekly Dec 27, 2020

DIA Chart
The DOW 30 Index is almost back up to the Top Trend Line.

12/27/2020 Markets were mixed for the week on low Holiday Volume. Many of the major Indices made New Highs but are very over-bought.  

The Herd is Buying on expectations that the World Economy will improve dramatically when the Virus is over. The Markets have probably discounted much of the improvement of the World Economy in the future. 

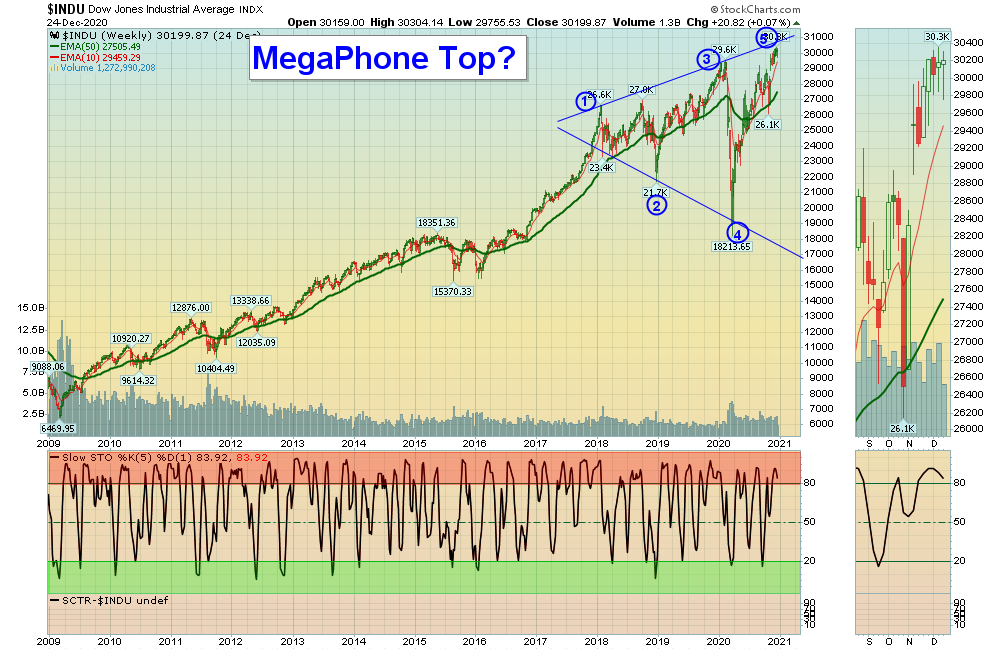
Historically the Markets are too far Above the Green Lines to justify a 2:1 Reward / Risk Ratio. So prudent Investors who like to Buy on FEAR should be raising Cash up here. We know from history that Markets stretched Way Above the Green Lines on Greed and Hope will eventually snap back down to the Green Line again.

Lots of Good News on the Markets, and Smart Money should take profits soon on the Good news of another Stimulus Plan. 

SEE SUPPLEMENTAL CHARTS

For the week the Dow was up 0.04%, the S&P 500 was down 0.05%, and the Nasdaq 100 was up 0.02%. The Long Term Trend for the Indices is up. 

The Inflation Index (CRB) was down 0.54% and is Above the Green Line, indicating Economic Expansion.

Bonds were up 0.61% for the week, and are Above the Green Line, indicating Economic Weakness.

The US DOLLAR was up 0.37% for the week, and is over-sold. 

Crude Oil was down 2.05% for the week at $48.23 and GOLD was down 0.30%  at $1883.20.

_____________________________________________________________________________________________

MONEY WAVE BUYS SOON

We are currently in 4 logged Current Positions, for the Short & Medium Term.  There are 4 Investments on the Short Term Watch List. 

Be patient and WAIT for Green Zone Buy Signals!

______________________________________________________________________________________________

LONG TERM INVESTMENTS  (Most of the Leaders are back up in the Weekly Red Zones.)

Buy the Leading Investments that are down near the Weekly Green Zones.      

AR      ANTERO RESOURCES        Wait for the next Daily Money Wave Buy Signal.

CRON      CRONOS GROUP      Buy if it Closes above $9.00 on High Volume.      

LAC      LITHIUM AMERICAS CORP.      Quickly surged up thru the Red Line and Closed up  31.8 %. So we missed it…

RIOT      RIOT BLOCKCHAIN      Wait for the next Daily Money Wave Buy Signal.

ZM       ZOOM VIDEO      Wait for Close Above the Red Line.

______________________________________________________________________________________

Click for  Watch Lists
Click for  Current Positions
Click for  Closed Positions

New: My Trading Dashboard

Day Trading Watch List

TOP 100 LIST Dec 3, 2020

Dividend Growth Portfolio  

ETF Sector Rotation System 

Dogs of the DOW System

Long Term Strategy for IRAs & 401k Plans

CNN Fear & Greed Index

Alert! Market Risk is HIGH (Red Zone). The probability of successful Short Term Trades is better, when the % of stocks above the 50-day avg. is below 20. 

Tell your Friends about the Green Line, and Help Animals.

___________________________________________________________________________________________

QUESTION:  Winter writes ““Don’t take a Loss” confuses me. What does that mean?”

ANSWER:  When the Investment has a Money Wave Buy Signal, it should pop up 3-6 % in just a few days. 

If it is not popping up well, and the Money Wave > 50, either Get the H out, or Don’t Take a Loss!

Something must be Wrong. There will be plenty more… Raise Cash, and don’t get Stuck! Wait for the next one.

Good trading and tell your friends!

AGL

Related Post

– Green Line Weekly Dec 20, 2020

Subscribe to Our Newsletter

AGL Logo

Get our eBook Now!

Candlestick - A Swing Traders Friend

We don’t spam! Read our privacy policy for more info.

You’ve been successfully subscribed to our newsletter!

Voted #1 at Stock Charts

SH Chart
Inverse S&P 500 Fund (SH) will have a Money Wave Buy today.

Help Us Help Animals

Help Us Help Animals

Recent Comments

  • Market Breadth Indicators: A Trader’s Guide to Early Trend Detection on Backtesting: Definition and How a Trading Strategy Backtest Works
  • Island Reversal Pattern: Definition and Formation Explained on Double Top Pattern: How to Identify and Trade This Reversal Signal
  • Channel Pattern Guide: What It Is and Why It Matters on A Guide to Forecasting Using Moving Averages
  • What Is a Broadening Bottom Chart Pattern? Full Guide on Bull vs. Bear Market: An Investor’s Guide to Market Phases
  • ATGL Weekly Money Flow - 2025-05-11 on ATGL Top Pick of the Week! Apr 6, 2025

Become a Green Liner!

Help me make more Money in the Stock Market.

ON ATGL

  • DashBoard
  • Weekly Commentary
  • Daily Buy / Sell Signals
  • Day Trade Setup
  • Trading Rooms

Design & Develop By Pixelvect

STRATEGIES

  • Swing Trading
  • ATGL Pick of the Week
  • Dividend Growth
  • ETF Sector Rotation
  • Dogs of the Dow

HELP

  • ATGL Trading Rules
  • FAQ
  • Account Maintenance
  • Contact US
  • Join

FOLLOW US

Instagram Linkedin Twitter Facebook

© COPYRIGHT 2024 · ABOVETHEGREENLINE.COM · ALL RIGHTS RESERVED · PRIVACY · TERMS · CONTACT · WATCHLIST · CURRENT