Above the Green Line -01
  • Market Insights
        • Commentary
          • Daily
          • Weekly
        • BUY / SELL SIGNALS
          • Trade Posts
          • Recent Trade Alerts
          • Recent Day Trades
        • BLOGROLL
          • Dividend Growth Blog
          • ETF Sector Blog
          • Dow Dogs
          • TPOW Blog
  • Strategies
        • SWING TRADING
          • Current Positions
          • Watchlists
          • Closed Positions
          • Candidates - TOP 100
          • Specialty Stocks
        • WEEKLY STOCK PICK
          • TPOW Charts
          • TPOW Performance
          • TPOW Strategy Guide
          • TPOW Performance Dashboard
        • DAY TRADING
          • Watch List
        • ATGL DASHBOARD
        • ETF STRATEGIES
          • ETF Sector Rotation
          • ETF Sector Portfolio
        • DIVIDEND GROWTH
          • Dividend Growth Portfolio
          • Dividend Calendar
        • DOGS OF THE DOW
          • Dogs of the Dow Portfolio
          • DOW 5 Portfolio
  • Markets
        • US MARKET
          • Commodities
          • Energy
          • Precious Metals
          • Volatility
        • GLOBAL MARKETS
          • Market Indices
          • Economic Calendar
          • FOREX Heat Map
          • FOREX Cross Rates
          • Crypto Currency Market
  • Investing
    • Discord Community
    • Dashboard
  • Resources
        • ARTICLES
          • Dividend Growth Model Articles
          • ETF Articles
          • Investment Strategies Articles
          • Market and Economic Insights
          • Stock Trade Articles
          • Stock Reviews
        • TOOLS
          • Stock Scanners
          • Charting Software
          • Brokerage Firms
        • STOCK CHARTS
          • Key Components
          • Reading Charts
          • Drawing Stock Charts
          • Identifying Trends
        • RETIREMENT PLANNING
  • About
    • Contact Us
    • How to Win
    • #1 At Stockcharts
    • Disclaimer
    • FAQ
  • Log In
  • Subscribe

Accumulation Distribution Line

Accumulation Distribution Line

Developed by Marc Chaikin, the Accumulation Distribution Line is a volume-based indicator designed to measure the cumulative flow of money into and out of a security.

KEY TAKEWAYS

  • The accumulation/distribution line gauges supply and demand by looking at where the price closed within the period’s range, and then multiplying that by volume.
  • The A/D indicator is cumulative, meaning one period’s value is added or subtracted from the last.
  • A rising A/D line helps confirm a rising price trend.
  • A falling A/D line helps confirm a price downtrend.
  • If the price is rising but A/D is falling, it signals underlying weakness and a potential decline in price.
  • If the price of an asset is falling but A/D is rising, it signals underlying strength and the price may start to rise.

The calculation of the Accumulation/Distribution Line is based on three key parts:

  • Money Flow Multiplier : fluctuates between +1 and -1 and thus dictates the direction
  • Money Flow Volume
  • ADL

Calculation of the Accumulation Distribution Line is shown in the figure below.

Accumulation Distribution Formula

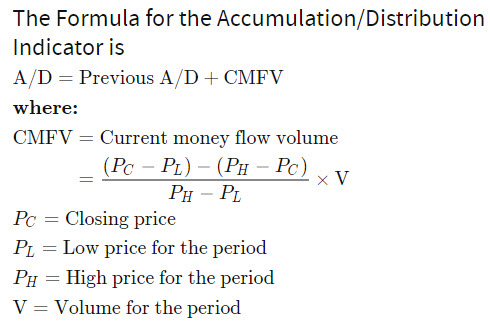
  • Start by calculating the multiplier. Note the most recent period’s close, high, and low to calculate.
  • Use the multiplier and the current period’s volume to calculate the Money Flow Volume.
  • Add the Money Flow Volume to the last A/D value. For the first calculation use Money Flow Volume as the first value.
  • Repeat the process as each period ends, adding/subtracting the new Money Flow Volume to/from the prior total. This is A/D.

​
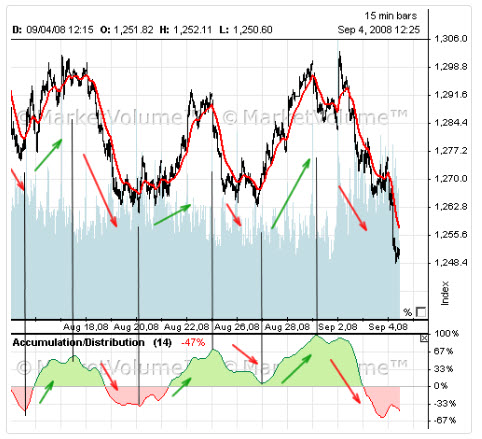
Highlighted in the figure below is the Accumulation / Distribution Line for the S&P 500 Index.

S&P 500 Index - Accumulation / Distribution Line

Final Thoughts

The Accumulation Distribution Line can be used to gauge the general flow of volume. An uptrend indicates that buying pressure is prevailing on a regular basis, while a downtrend indicates that selling pressure is prevailing. Bullish and bearish divergences serve as alerts for a potential reversal on the price chart. As with all indicators, it is important to use the Accumulation Distribution Line in conjunction with other aspects of technical analysis, such as momentum oscillators and chart patterns. It is not a standalone indicator.

Subscribe to Our Newsletter

AGL Logo

Get our eBook Now!

Candlestick - A Swing Traders Friend

We don’t spam! Read our privacy policy for more info.

You’ve been successfully subscribed to our newsletter!

Voted #1 at Stock Charts

SH Chart
Inverse S&P 500 Fund (SH) will have a Money Wave Buy today.

Help Us Help Animals

Help Us Help Animals

Recent Comments

  • Market Breadth Indicators: A Trader’s Guide to Early Trend Detection on Backtesting: Definition and How a Trading Strategy Backtest Works
  • Island Reversal Pattern: Definition and Formation Explained on Double Top Pattern: How to Identify and Trade This Reversal Signal
  • Channel Pattern Guide: What It Is and Why It Matters on A Guide to Forecasting Using Moving Averages
  • What Is a Broadening Bottom Chart Pattern? Full Guide on Bull vs. Bear Market: An Investor’s Guide to Market Phases
  • ATGL Weekly Money Flow - 2025-05-11 on ATGL Top Pick of the Week! Apr 6, 2025

Become a Green Liner!

Help me make more Money in the Stock Market.

ON ATGL

  • DashBoard
  • Weekly Commentary
  • Daily Buy / Sell Signals
  • Day Trade Setup
  • Trading Rooms

Design & Develop By Pixelvect

STRATEGIES

  • Swing Trading
  • ATGL Pick of the Week
  • Dividend Growth
  • ETF Sector Rotation
  • Dogs of the Dow

HELP

  • ATGL Trading Rules
  • FAQ
  • Account Maintenance
  • Contact US
  • Join

FOLLOW US

Instagram Linkedin Twitter Facebook

© COPYRIGHT 2024 · ABOVETHEGREENLINE.COM · ALL RIGHTS RESERVED · PRIVACY · TERMS · CONTACT · WATCHLIST · CURRENT