Above the Green Line -01
  • Market Insights
        • Commentary
          • Daily
          • Weekly
        • BUY / SELL SIGNALS
          • Trade Posts
          • Recent Trade Alerts
          • Recent Day Trades
        • BLOGROLL
          • Dividend Growth Blog
          • ETF Sector Blog
          • Dow Dogs
          • TPOW Blog
  • Strategies
        • SWING TRADING
          • Current Positions
          • Watchlists
          • Closed Positions
          • Candidates - TOP 100
          • Specialty Stocks
        • WEEKLY STOCK PICK
          • TPOW Charts
          • TPOW Performance
          • TPOW Strategy Guide
          • TPOW Performance Dashboard
        • DAY TRADING
          • Watch List
        • ATGL DASHBOARD
        • ETF STRATEGIES
          • ETF Sector Rotation
          • ETF Sector Portfolio
        • DIVIDEND GROWTH
          • Dividend Growth Portfolio
          • Dividend Calendar
        • DOGS OF THE DOW
          • Dogs of the Dow Portfolio
          • DOW 5 Portfolio
  • Markets
        • US MARKET
          • Commodities
          • Energy
          • Precious Metals
          • Volatility
        • GLOBAL MARKETS
          • Market Indices
          • Economic Calendar
          • FOREX Heat Map
          • FOREX Cross Rates
          • Crypto Currency Market
  • Investing
    • Discord Community
    • Dashboard
  • Resources
        • ARTICLES
          • Dividend Growth Model Articles
          • ETF Articles
          • Investment Strategies Articles
          • Market and Economic Insights
          • Stock Trade Articles
          • Stock Reviews
        • TOOLS
          • Stock Scanners
          • Charting Software
          • Brokerage Firms
        • STOCK CHARTS
          • Key Components
          • Reading Charts
          • Drawing Stock Charts
          • Identifying Trends
        • RETIREMENT PLANNING
  • About
    • Contact Us
    • How to Win
    • #1 At Stockcharts
    • Disclaimer
    • FAQ
  • Log In
  • Subscribe

Archives for October 2019

October 9, 2019

Money Wave Alert! Oct 9, 2019

ROKU Chart

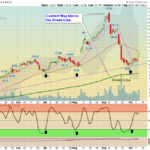
  Markets  "gapped up" today on Low Volume. Markets don't know what to do now. The S&P 500 Index has Resistance of the Red Line (50-day avg.) of 2946 and  needs to hold above last week's Low of 2875 to become Bullish. Please be patient … [Read more...]

October 8, 2019

Money Wave Alert! Oct 8, 2019

DIA Chart

  Markets  "gapped down" today as the S&P 500 Index failed at the Resistance of the Red Line (50-day avg.) of 2950. Volume is Low. The S&P 500 needs to hold above last week's Low of 2875 to become Bullish. Home Builders and … [Read more...]

October 7, 2019

Money Wave Alert! Oct 7, 2019

TLT Chart

  EARLY EDITION Markets  were mixed today as the S&P 500 Index is over-bought from the rally up last week off the Green Line. Now there is Resistance at the Red Line (50-day avg.) of 2950. Volume is Low. Please be patient and WAIT … [Read more...]

October 6, 2019

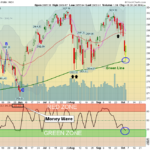
Green Line Weekly Oct 6, 2019

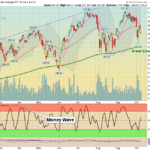
  10/06/2019:  Markets did not bounce up at the Red Lines (50-day avgs.) last week, and dropped down near the Green Lines before bouncing back up. So far the Bears got a Double Top pattern on the S&P 500 Index. But the Bulls are … [Read more...]

October 4, 2019

Money Wave Alert! Oct 4, 2019

QQQ

  Markets  were up again today as the S&P 500 Index is almost back up to the Red Line of 2949 and Resistance. Volume is Low. Emotions are High as Investors react from Good News and Bad News each day. This indicates equilibrium: same … [Read more...]

October 3, 2019

Money Wave Alert! Oct 3, 2019

SPX Chart

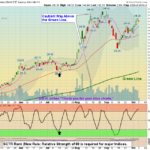
  Markets  were up slightly today after the S&P 500 Index dipped down almost to the Green Line this morning, and bounced. The S&P 500 Index is back down in the Green Zone, but the Relative Strength has dropped below 80 required for … [Read more...]

October 2, 2019

Money Wave Alert! Oct 2, 2019

DIA Chart

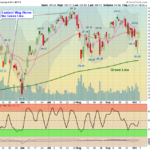
  Markets  were down again today after the S&P 500 Index closed below the Red Line (50-day avg.) yesterday and then sold off more today. Now Support is the Green Line at 2852. The Tech stocks have been under a lot of pressure, and are … [Read more...]

October 1, 2019

Money Wave Alert! Oct 1, 2019

  Markets  were down today after the S&P 500 Index went slightly above the Pink Line (10-day avg.) and then sold off. Closing above 2981 on the S&P 500 should bring in more Buying. The Tech stocks have been under a lot of pressure, … [Read more...]

  • « Previous Page
  • 1
  • 2
  • 3

Subscribe to Our Newsletter

AGL Logo

Get our eBook Now!

Candlestick - A Swing Traders Friend

We don’t spam! Read our privacy policy for more info.

You’ve been successfully subscribed to our newsletter!

Voted #1 at Stock Charts

SH Chart
Inverse S&P 500 Fund (SH) will have a Money Wave Buy today.

Help Us Help Animals

Help Us Help Animals

Recent Comments

  • Market Breadth Indicators: A Trader’s Guide to Early Trend Detection on Backtesting: Definition and How a Trading Strategy Backtest Works
  • Island Reversal Pattern: Definition and Formation Explained on Double Top Pattern: How to Identify and Trade This Reversal Signal
  • Channel Pattern Guide: What It Is and Why It Matters on A Guide to Forecasting Using Moving Averages
  • What Is a Broadening Bottom Chart Pattern? Full Guide on Bull vs. Bear Market: An Investor’s Guide to Market Phases
  • ATGL Weekly Money Flow - 2025-05-11 on ATGL Top Pick of the Week! Apr 6, 2025

Become a Green Liner!

Help me make more Money in the Stock Market.

ON ATGL

  • DashBoard
  • Weekly Commentary
  • Daily Buy / Sell Signals
  • Day Trade Setup
  • Trading Rooms

Design & Develop By Pixelvect

STRATEGIES

  • Swing Trading
  • ATGL Pick of the Week
  • Dividend Growth
  • ETF Sector Rotation
  • Dogs of the Dow

HELP

  • ATGL Trading Rules
  • FAQ
  • Account Maintenance
  • Contact US
  • Join

FOLLOW US

Instagram Linkedin Twitter Facebook

© COPYRIGHT 2024 · ABOVETHEGREENLINE.COM · ALL RIGHTS RESERVED · PRIVACY · TERMS · CONTACT · WATCHLIST · CURRENT