Above the Green Line -01
  • Market Insights
        • Commentary
          • Daily
          • Weekly
        • BUY / SELL SIGNALS
          • Trade Posts
          • Recent Trade Alerts
          • Recent Day Trades
        • BLOGROLL
          • Dividend Growth Blog
          • ETF Sector Blog
          • Dow Dogs
          • TPOW Blog
  • Strategies
        • SWING TRADING
          • Current Positions
          • Watchlists
          • Closed Positions
          • Candidates - TOP 100
          • Specialty Stocks
        • WEEKLY STOCK PICK
          • TPOW Charts
          • TPOW Performance
          • TPOW Strategy Guide
          • TPOW Performance Dashboard
          • Why Weekly Trading Works
        • DAY TRADING
          • Watch List
        • ATGL DASHBOARD
        • ETF STRATEGIES
          • ETF Sector Rotation
          • ETF Sector Portfolio
        • DIVIDEND GROWTH
          • Dividend Growth Portfolio
          • Dividend Calendar
        • DOGS OF THE DOW
          • Dogs of the Dow Portfolio
          • DOW 5 Portfolio
  • Markets
        • US MARKET
          • Commodities
          • Energy
          • Precious Metals
          • Volatility
        • GLOBAL MARKETS
          • Market Indices
          • Economic Calendar
          • FOREX Heat Map
          • FOREX Cross Rates
          • Crypto Currency Market
  • Investing
    • Discord Community
    • Dashboard
  • Resources
        • ARTICLES
          • Dividend Growth Model Articles
          • ETF Articles
          • Investment Strategies Articles
          • Market and Economic Insights
          • Stock Trade Articles
          • Stock Reviews
        • TOOLS
          • Stock Scanners
          • Charting Software
          • Brokerage Firms
          • Stocks We Review
        • STOCK CHARTS
          • Key Components
          • Reading Charts
          • Drawing Stock Charts
          • Identifying Trends
        • RETIREMENT PLANNING
  • About
    • Contact Us
    • How to Win
    • #1 At Stockcharts
    • Disclaimer
    • FAQ
  • Log In
  • Subscribe

Archives for 2018

March 7, 2018

Money Wave Alert! Mar 7, 2018

SPX Chart

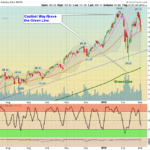
  Markets were mostly mixed again today, after "Gapping Down" on the opening. The Strongest Leaders are not coming down enough to make it into the Green Zones for Money Wave Buys... This shows that most are not Selling. Investments that … [Read more...]

March 6, 2018

Money Wave Alert! Mar 6, 2018

TLT Chart

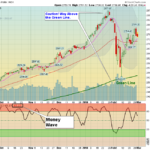
  Markets are mixed today, after many Money Wave Buy signals kicked in yesterday to cause a rally. So far the bounces have not been very good, because the decline down was small. The Strongest did not make it down into the Green Zones for … [Read more...]

March 5, 2018

Money Wave Alert! Mar 5, 2018

DIA Chart

  Markets bounced today, as many Money Wave Buy signals kicked in . Some of the Strongest Investments did not Close in the Green Zones, as the decline was small... We will not trade these, as the Rules require a Close in the Green … [Read more...]

March 4, 2018

Green Line Weekly Mar 4, 2018

SPX Index

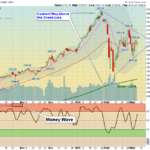
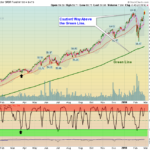
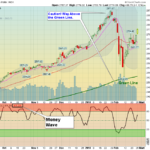
  03/04/2018:  Markets were down about 2% for the week, as they rolled over to re-test the February lows .  It would be Bullish if this down move drops less than in Feb. Then the Markets could re-test the January Highs. The Markets are … [Read more...]

March 2, 2018

Money Wave Alert! Mar 2, 2018

QQQ Chart

  Markets were down again today, but the major Indices will probably close well above today's lows.  Now the Leaders are coming back down to their Green Zones for Buy Signals. The Watch List is growing with Investments to consider soon. … [Read more...]

March 1, 2018

Money Wave Alert! Mar 1, 2018

Watch List

  Markets are down again today, as the major Indices Closed below the Pink Lines (10-day avgs.) last night, creating  Short Term Sell Signals.  Now the Leaders are coming back down to their Green Zones for Buy Signals. The Watch List is … [Read more...]

February 28, 2018

Money Wave Alert! Feb 28, 2018

SPX Chart

  Markets are down again today, as the major Indices are moving down to the Pink Lines (10-day avgs.) The S&P 500 needs to bounce around 2730 soon to avoid a Short Term Sell Signal. Markets should bounce off the Pink Lines. We are … [Read more...]

February 27, 2018

Money Wave Alert! Feb 27, 2018

XLK Chart

  Markets are down today, as Bonds turned back down (long term Interest Rates rose).  The major Indices are still Above the Pink Lines (10-day avgs.) so no Short Term Sell Signals. Markets should bounce off the Pink Lines. You can see that … [Read more...]

February 26, 2018

Money Wave Alert! Feb 26, 2018

SPX Chart

  Markets are higher today, as Bonds finally bounced off of Over-Sold levels (long term Interest Rates dropped).  However, Bonds will normally re-test the recent Lows again. We are waiting on the Leaders to come back down from the Red … [Read more...]

February 25, 2018

Green Line Weekly Feb 25, 2018

TWTR Chart

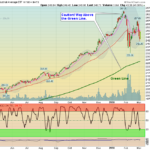
  02/25/2018:  Markets were up slightly for the Holiday shortened week. The S&P 500 hoovered above the Red Line (50-day avg.) as there were few sellers. So far all only the very Strongest Leaders and the NASDAQ 100 Index are back up near … [Read more...]

  • « Previous Page
  • 1
  • …
  • 24
  • 25
  • 26
  • 27
  • 28
  • …
  • 31
  • Next Page »

Subscribe to Our Newsletter

AGL Logo

Get our eBook Now!

Candlestick - A Swing Traders Friend

We don’t spam! Read our privacy policy for more info.

You’ve been successfully subscribed to our newsletter!

Voted #1 at Stock Charts

SH Chart
Inverse S&P 500 Fund (SH) will have a Money Wave Buy today.

Help Us Help Animals

Help Us Help Animals

Recent Comments

  • ATGL Weekly Money Flow - 2026-02-08 on ATGL Top Pick of the Week! Jan 25, 2026
  • ATGL Weekly Money Flow - 2026-01-25 on ATGL Top Pick of the Week! Jan 11, 2026
  • ATGL Weekly Money Flow - 2025-12-28 on ATGL Top Pick of the Week Dec 21, 2025
  • Inside Bar Trading Strategy: Improve Timing and Wins on Price Action Trading: Mastering the Art of Reading the Market Without Indicators
  • Breakaway Gap Explained: Identify High-Probability Setups on Identifying Market Exhaustion Signals for Smarter Trading Decisions

Become a Green Liner!

Help me make more Money in the Stock Market.

ON ATGL

  • DashBoard
  • Weekly Commentary
  • Daily Buy / Sell Signals
  • Day Trade Setup
  • Trading Rooms

Design & Develop By Pixelvect

STRATEGIES

  • Swing Trading
  • ATGL Pick of the Week
  • Dividend Growth
  • ETF Sector Rotation
  • Dogs of the Dow

HELP

  • ATGL Trading Rules
  • FAQ
  • Account Maintenance
  • Contact US
  • Join

FOLLOW US

Instagram Linkedin Twitter Facebook

© COPYRIGHT 2024 · ABOVETHEGREENLINE.COM · ALL RIGHTS RESERVED · PRIVACY · TERMS · CONTACT · WATCHLIST · CURRENT