

By ATGL
Updated March 12, 2026
The future is tech. So, if you want to be part of the future, Technology Exchange-Traded Funds (ETFs) are where it’s at. You probably already know this, and now your biggest predicament is deciding which ETF you should invest your money in. Two of the most popular funds, Technology Select Sector SPDR Fund (XLK) and Invesco QQQ Trust (QQQ), stand out as investment options you can choose from.
Investors comparing ETFs like XLK and QQQ often benefit from understanding how exchange-traded funds are structured, how they track indexes, and how they fit into broader portfolio strategies. For a deeper overview of ETF fundamentals and how investors evaluate different funds, explore the ETF Investing Guide, which explains the key principles behind ETF selection and portfolio construction.
Sure, both have their merits, but understanding the differences between these two is essential for ensuring you choose the one that yields the best returns and meets your investment objectives. Below is a comparison analysis between XLK vs QQQ highlighting some of the key differences between the two tech ETFs.
The Difference Between XLK and QQQ
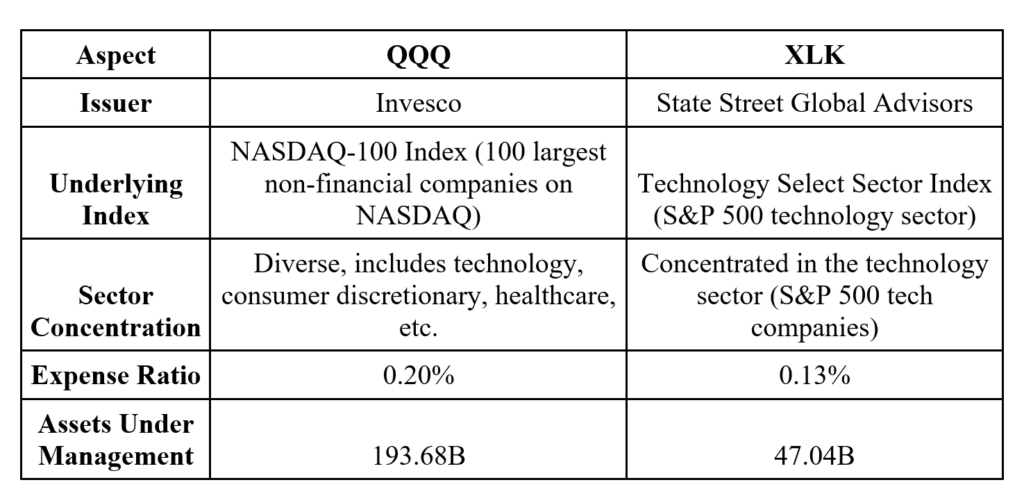
The main notable difference between QQQ vs XLK comes from their underlying indices and sector concentration.
XLK ETF tracks the Technology Select Sector Index, which comprises companies from the S&P 500 Index tightly categorized within the technology sector. This includes a broad range of technology companies, such as Apple, Microsoft, and Intel, which are known to have larger market capitalizations. Because of its concentration in the technology sector, its performance will normally exhibit significant price movements, both up and down, in response to the tech sector’s market conditions and trends.
Alternatively, Invesco QQQ ETF tracks the NASDAQ-100 Index, which includes 100 of the largest non-financial companies listed on the NASDAQ stock exchange, often referred to as the “NASDAQ-100 ETF.” While it has a significant technology component, it also includes other sectors, like consumer discretionary and healthcare.
QQQ therefore boasts a higher level of assets under management (at $193.68 billion) than XLK (at $47.04 billion) because of its diversified portfolio. Due to its diversified portfolio across the business sector, investing in QQQ can help to spread risk, which is essential for stability, but may reduce the potential for higher returns if the tech sector outperforms other sectors.
Regarding expense ratios (the annual cost of managing the fund), the expense ratio for XLK is relatively low at 0.10 percent, which makes it a cost-effective choice for investors. It is known for its efficient cost structure. QQQ also has a competitive expense ratio of 0.20 percent, which is slightly higher than XLK due to its broader index composition.
The Performance of XLK and QQQ ETFs Based on Time Frame
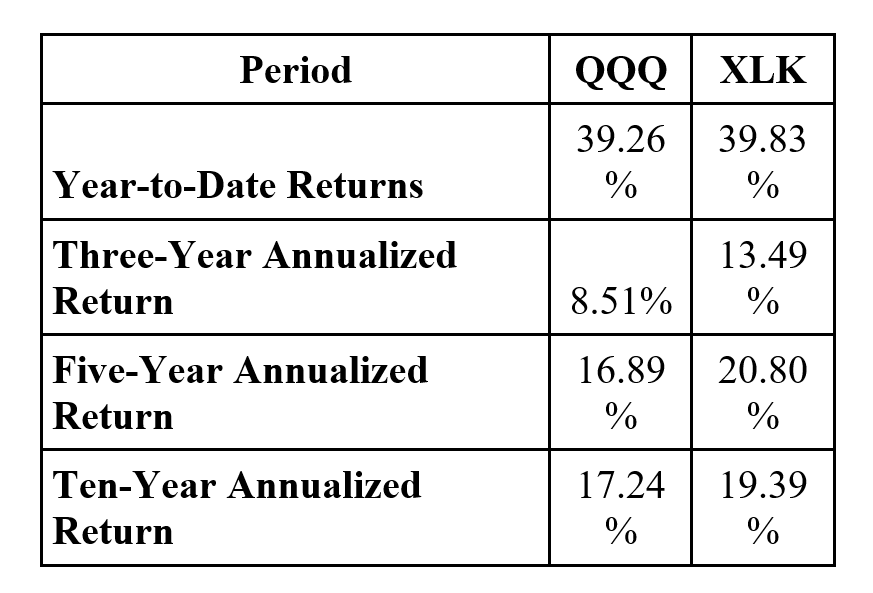
Here’s a detailed ETF performance comparison of XLK vs QQQ:
Year-to-Date Returns
As of November 2023, there was a very small difference in the year-to-date returns (YTD) between the two EFTS, with QQQ boasting a 39.26 percent return while XLK registered a 39.83 percent return.
Three-Year Annualized Return
From 2021 to 2023, QQQ has achieved an annualized return of 8.51 percent, while XLK has consistently outperformed QQQ with a higher annualized return of 13.49 percent.
Five-Year Annualized Return
Over a five-year horizon, the annualized returns reveal a similar pattern to the YTD and three-year annualized returns. QQQ delivered an annualized return of 16.89 percent, whereas XLK again demonstrated slightly stronger performance with an annualized return of 20.80 percent.
Ten-Year Annualized Return
Comparing the QQQ and XLK over the past 10 years, the QQQ had an annualized return of 17.24, while XLK posted a slightly higher annualized return of 19.39 percent. The historical data illustrates that XLK has maintained a slight edge in returns over the longer term, reflecting its performance advantage. You could therefore say that XLK holds the trophy for the best tech ETF for long-term investments.
Learn How To Boost Your Technology Stock Investment
You can’t go wrong investing in technology, but recognizing the differences between XLK and QQQ, two of the most popular tech ETFs, is essential. Even better, with ETF sector rotation, you can boost your tech stock investment.
The ETF sector rotation strategy involves periodically reallocating your investments among different sector-specific ETFs, including technology. With ETF sector rotation, you can take advantage of growing sectors of the economy and avoid declining ones. This systematic approach streamlines your investment strategy and can help you make informed decisions in an ever-changing market.
The Green Line Strategy draws strongly from ETF rotation by emphasizing that you should own the five strongest ETFs and rotate them every three months, providing a disciplined and effective way to optimize your technology stock investments.

Related Articles

Consumer Staples ETF: Top Funds, Holdings, and When to Actually Use Them
Index Funds vs Mutual Funds: Key Differences, Costs, and Which Is Better

Margin Call Explained: What Triggers It and How to Avoid One

AMC Short Squeeze Explained: Timeline, Causes, and Trading Risks
DBC ETF Guide: Is This Commodity Fund Worth the Risk?
