The plowback ratio, also known as the retention ratio, is an essential indicator in financial analysis. It represents the fraction of a company’s net income that is not paid out as dividends, but is instead kept within the company for reinvestment and increased cash holdings. These funds are typically referred to as retained earnings.
The plowback ratio sheds light on a company’s strategic approach to growth, revealing whether its focus lies in reinvesting earnings into operational enhancements or in distributing profits to shareholders.
What Is the Plowback Ratio?
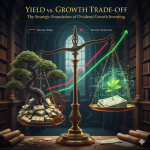
The plowback ratio stands as the counterpoint to the dividend payout ratio. As mentioned above, it represents the percentage of net income that a company retains rather than distributes as dividends.
This calculation is key to evaluating a company’s strategy concerning its profits, offering insights into whether it prioritizes fortifying its financial foundation for long-term growth or opts for immediate distribution of returns to its shareholders.
Understanding the plowback ratio requires a quick dive into a company’s financials. For instance, if a company earns a net income of $100 million and pays out $20 million as dividends, its plowback ratio stands at 80%. This indicates that the company retains a substantial portion of its earnings, potentially for debt reduction, research and development, expansion, or other future growth prospects.
Companies with higher retention ratios, like tech giants Google and Amazon, often signal robust plans for achieving higher growth. On the other hand, a company with a lower ratio between 30% and 50% may be striking a balance between reinvesting for growth and providing shareholder returns.
How To Calculate the Plowback Ratio
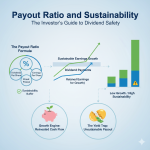
Also referred to as the retention ratio formula, the formula for the plowback ratio is:
Plowback Ratio = 1 − (Annual Dividend Per Share/Earnings Per Share)
Alternatively, it can be expressed as:
Retained Earnings Ratio = (Net Income − Dividends Paid)/Net Income
For example, if a company has earnings per share of $10 and pays dividends per share of $4, the dividend payout ratio would be 40%, and the earnings retention ratio would be 60%. This fundamental analysis calculation demonstrates the portion of profits being reinvested in the company versus the amount distributed to shareholders.
Key Factors That Affect Plowback
The plowback ratio is influenced by a variety of factors:
- Industry Dynamics: The norm for plowback can vary widely across industries. For instance, technology companies often have higher ratios due to continuous investment in innovation, whereas utilities might show lower ratios, reflecting their stable, dividend-paying nature.
- Company Life Cycle: Younger growth-stage companies usually exhibit higher plowback ratios, reinvesting earnings to fuel their expansion. In contrast, more mature companies might opt for higher dividend distributions, reflecting a lower need for aggressive reinvestment.
- Economic Conditions: Broader economic factors can also sway a company’s plowback ratio. In times of economic uncertainty, firms might retain more earnings as a buffer against market volatility.
- Management Preferences: The attitude of management plays a central role in determining the plowback ratio. Some executives may prefer to prioritize growth, while others might lean toward rewarding shareholders with higher dividend payments.
- Capital Requirements: Companies that require significant capital investment for expansion projects or acquisitions might have lower plowback ratios as they allocate more earnings toward financing these initiatives.
What This Ratio Tells You About a Company’s Growth Potential
A high plowback ratio often signals that a company is betting on its future growth potential. It suggests that management is confident in the company’s ability to generate higher returns through internal investments than what could be achieved by distributing the money as dividends.
On the other hand, a lower ratio might indicate a strategy that favors distributing dividends to shareholders for immediate shareholder value, possibly due to limited available growth opportunities.
Focus on Growth and Become an Income-Oriented Investor
The plowback ratio is a beacon guiding informed investment decisions. Understanding this ratio allows growth-oriented investors to align their portfolio with their specific investment objectives, whether that’s capital appreciation through investing in companies with high plowback ratios or steady income through dividends from companies with lower ratios.
Like other financial ratios, the plowback ratio should be considered alongside other factors such as the company’s financial performance over multiple timeframes or the likelihood of the Federal Reserve’s monetary policy affecting the company’s growth potential.
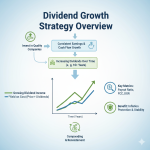
For those interested in delving deeper into the realms of dividend growth strategies, we invite you to explore Above The Greenline’s full guide on dividend growth investment strategy. This comprehensive resource provides a detailed overview of dividend growth investing, including how dividends work, the benefits of dividend growth strategies, stock selection criteria, and more.
This nuanced understanding of the plowback ratio empowers investors to strategize their investments, balancing growth potential against dividend income based on individual financial goals and risk tolerance.


