By ATGL
Updated July 20, 2026
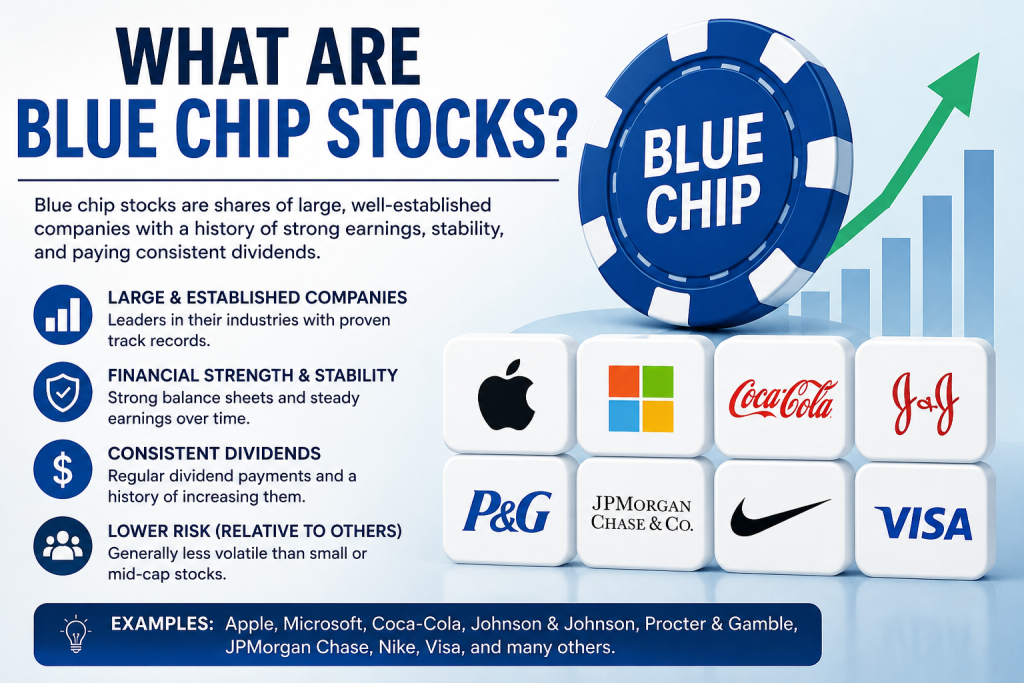
Whether a company qualifies as a blue chip is a conclusion investors can reach on their own by evaluating measurable financial traits rather than relying on its reputation. A blue chip stock is a share in a large, financially established company with a long record of stable earnings and dependable performance. No regulator awards the designation, and no official body maintains the list, which leaves the assessment to the investor.
So, while it is easy to find lists of well-known blue-chip stocks, a single list of names cannot tell you whether a given company still meets the standard. The sections below set out the criteria that can—market capitalization, dividend consistency, balance sheet strength, and long-term price behavior—and show how to apply them. For how they fit into a full approach to buying, holding, and selling, this stock trading guide offers a broader view.
What Is a Blue Chip Stock?
A blue chip stock represents ownership in an established corporation known for stability, reliable earnings, and a substantial market presence. The term originates in poker, where blue chips historically carried the highest value at the table. Applied to equities, it signals companies that have demonstrated durability across multiple economic cycles rather than short-term momentum.
Several markers commonly accompany blue-chip companies. Market capitalization typically exceeds $10 billion, and many hold membership in major indexes. The Dow Jones Industrial Average is built from 30 large U.S. companies that its provider, S&P Dow Jones Indices, calls blue chips, currently including Apple, Microsoft, Coca-Cola, and Johnson & Johnson. These firms generally maintain manageable debt, produce consistent earnings, and often carry a lengthy history of dividend payments.
Familiar blue-chip stock examples, therefore, span consumer staples, technology, and health care corporations that have operated profitably for decades.
Because no governing body certifies the category, any blue-chip stocks list reflects the judgment of whoever assembled it. That absence of an official standard is exactly why objective criteria matter. They replace opinion with evidence an investor can verify.
How to Evaluate Blue Chip Stocks
Assessing a blue chip requires examining four measurable characteristics. A strong candidate should satisfy all four rather than only one.
- Market capitalization: A valuation above $10 billion generally places a company in large-cap territory, and the largest blue chips extend well beyond it. Apple and Microsoft each carry a market capitalization measured in the trillions. Size alone, however, confirms nothing about durability.
- Dividend consistency: Many of the best blue-chip stocks return capital to shareholders through steady, frequently rising dividends, though not every blue chip pays them—some reinvest earnings into growth instead. Where dividends exist, a useful measure is the dividend payout ratio, calculated as Dividend Payout Ratio = Dividends Paid ÷ Net Income. A result between roughly 30% and 60% often indicates a company distributing profits while retaining enough to reinvest. Members of the S&P 500 Dividend Aristocrats index have raised dividends for at least 25 consecutive years. Procter & Gamble and Coca-Cola, for instance, have each done so for more than six decades. A list of blue-chip stocks with dividends overlaps heavily with these dividend aristocrats and with the narrower group of Dividend Kings, which have sustained increases for 50 years or longer.
- Balance sheet strength: Fundamental analysis of the balance sheet reveals whether a company can withstand adverse conditions. Manageable debt relative to equity, healthy cash reserves, and stable margins all point to balance sheet strength. Investors can review these figures directly in the quarterly and annual reports each public company files with the Securities and Exchange Commission. A firm carrying excessive leverage may falter during a downturn regardless of its standing.
- Long-term price trend behavior: A durable company should display a sustained upward price trend over extended periods, reflecting consistent business results rather than speculative interest.
Blue Chip Stocks vs. Large Cap Stocks
The terms blue chip and large cap are often used interchangeably, yet they describe different attributes. Large cap refers strictly to size—companies whose large cap stocks carry a market capitalization above a defined threshold, commonly $10 billion. That classification says nothing about profitability, debt, or operating history.
Blue chip status layers qualitative expectations onto size: a company must combine scale with consistency, financial soundness, and a demonstrated track record. Size is a prerequisite, not the full definition.
Where the Two Categories Overlap
Most blue-chip companies are large caps, but the reverse does not hold. A newly public technology firm may reach a large-cap valuation within months of listing while lacking the multi-decade earnings history and dividend record that define a blue chip.
A century-old consumer goods manufacturer such as Procter & Gamble, by contrast, satisfies both descriptions. Size establishes eligibility; consistency and financial strength determine whether a company qualifies as a blue chip.
Blue Chips in a Diversified Portfolio
Blue chip stocks are more resilient across market cycles than smaller or speculative holdings, yet resilience is not the same as safety. In bull markets, they participate in the gains but usually climb more slowly than high-growth names. In bear markets, they tend to fall less sharply than the broader market, and their dividends can keep paying income even when prices stagnate. The effect is steadier performance in both directions—not immunity from loss.
That relative stability makes blue chips a common foundation for a diversified portfolio, though treating them as risk-free would be a mistake. Even the largest, most stable companies can decline substantially when conditions deteriorate or a business model faces structural disruption.
Why Quality Doesn’t Guarantee Good Entries
A high-quality company and a well-timed purchase are separate matters. Reputation reflects what a company has already achieved; it does not indicate whether the current price offers a reasonable entry.
A well-known name can also lose its standing altogether. Walgreens, long a Dow component, was removed from the index in 2024 after a prolonged decline and replaced by Amazon. In the same period, 3M cut its dividend after spinning off its health care division, ending more than six decades of annual increases and forfeiting its Dividend Aristocrat status.
Even companies that keep their standing endure extended drawdowns, and several established names have traded below prior highs for years while their businesses remained sound. Paying a premium during a period of enthusiasm can lock in weak returns for a considerable stretch. Sound evaluation, therefore, weighs both the quality of the business and the behavior of its price.
When to Buy Blue Chip Stocks
Deciding whether a company is worth owning is a separate question from deciding when to buy it. The first depends on the quality of the business, and the second on how the stock is actually trading.
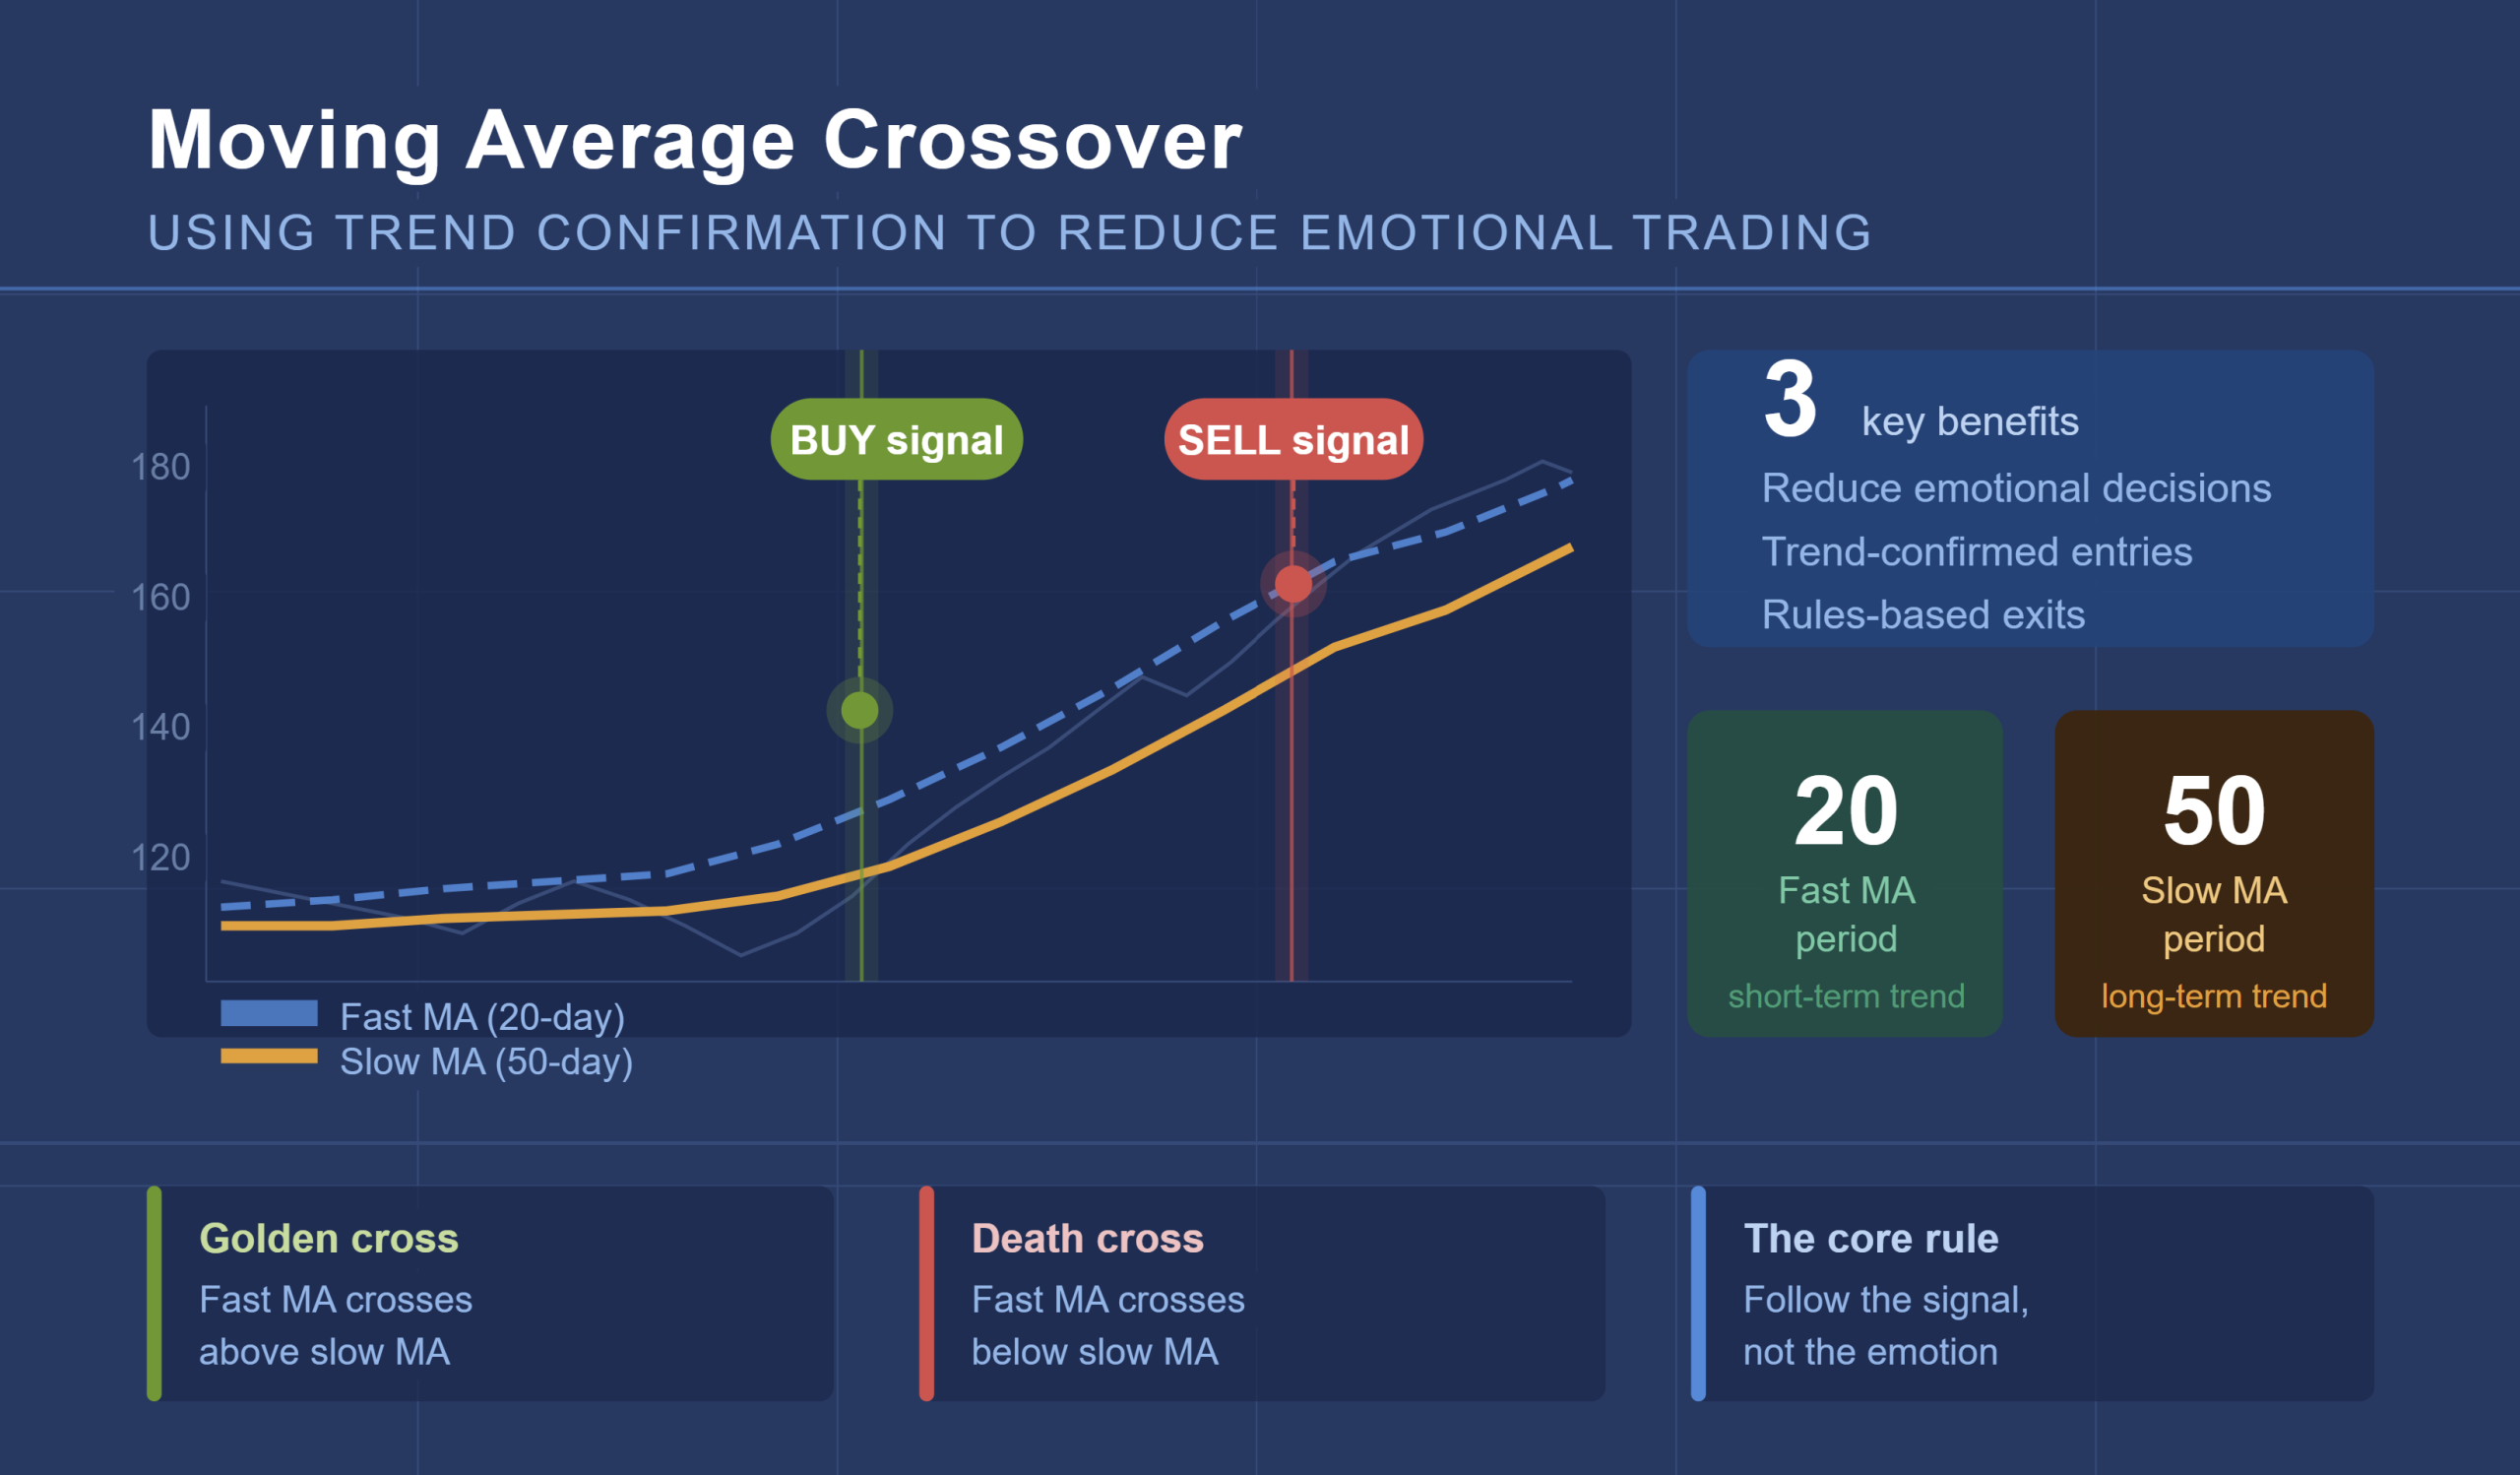
Relative strength measures how a stock performs against the broader market or its sector, helping identify when an established name is leading rather than lagging. Trend confirmation tools, such as a moving average crossover strategy, indicate when momentum has shifted in a stock’s favor. Together, these signals show when to act on a blue chip, not merely whether to own it.
This is where systematic evaluation replaces reliance on reputation. Above the Green Line uses a rules-based model to time decisions. It applies signals such as relative strength and moving averages to flag entry and exit points in long-standing stocks, so buy and sell timing rests on measurable evidence rather than reputation.
Investors seeking a disciplined framework for evaluating and timing blue-chip positions can explore Above the Green Line’s memberships for the charts and tools that support these decisions.