
S&P 500 Bounced at the Green Line!
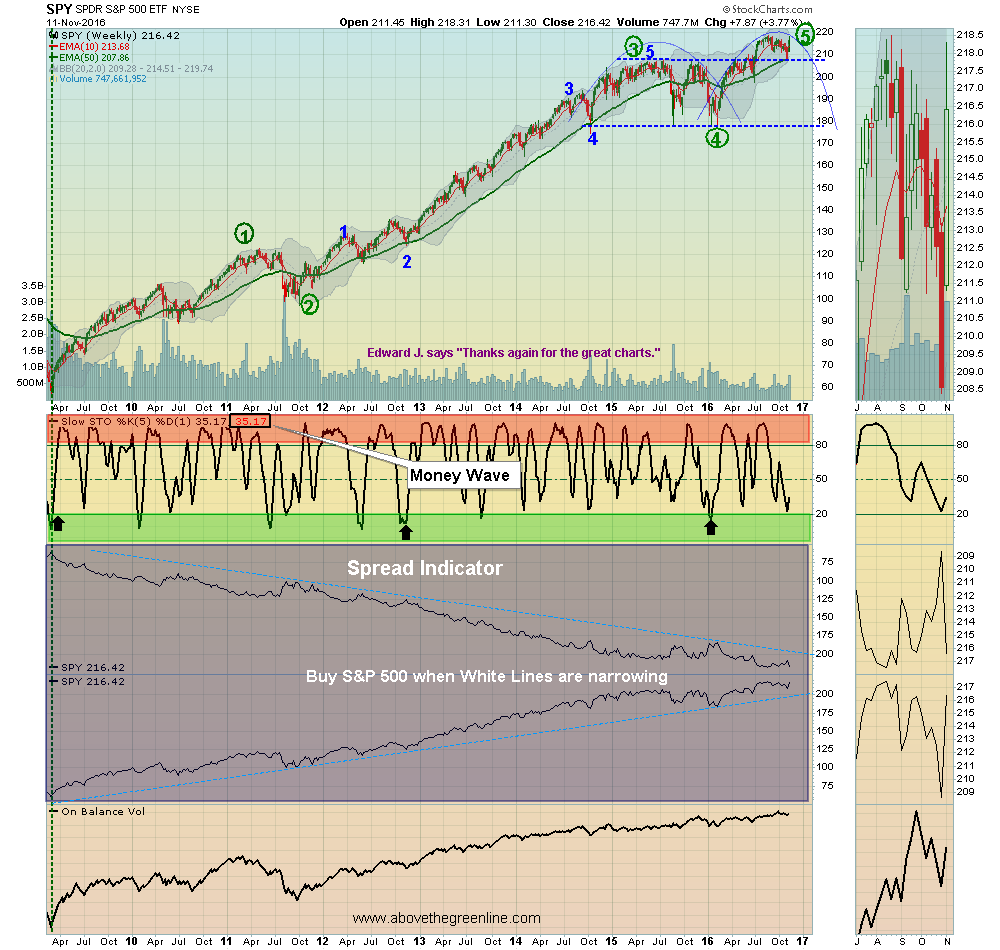
11/13/2016: Markets popped up big for the week as the S&P 500 bounced at the Green Line (250-day average).
FEAR was high, measured by the Volatility Index VIX, so the Markets bounced, as Tammy was buying Put Options (at the Green Line, when she should have been Buying LONG.
Now most leading Funds are back in the Red Zones (probably too late to Buy for the short term), so RAISE CASH.
The US Dollar is High, and Bonds tanked. Gold Miners dumped. Copper broke out.
Money Waves Buys soon for EWZ GDXJ JO. We will email you when they are ready. Watch List
Current Open Positions Closed Positions Charts for Leaders
Alert! Market Risk HIGH (Red Zone). The probability of successful Short Term Trades is lower, when the S&P 500 is Way Above the Green Line. Even the Strongest Funds can get chopped up. Either take quick gains from Money Wave Pops, or STAY IN CASH & WAIT for a larger correction.
Tell your Friends about us, and HELP ANIMALS.


