Above the Green Line -01
  • Market Insights
        • Commentary
          • Daily
          • Weekly
        • BUY / SELL SIGNALS
          • Trade Posts
          • Recent Trade Alerts
          • Recent Day Trades
        • BLOGROLL
          • Dividend Growth Blog
          • ETF Sector Blog
          • Dow Dogs
          • TPOW Blog
  • Strategies
        • SWING TRADING
          • Current Positions
          • Watchlists
          • Closed Positions
          • Candidates - TOP 100
          • Specialty Stocks
        • WEEKLY STOCK PICK
          • TPOW Charts
          • TPOW Performance
          • TPOW Strategy Guide
          • TPOW Performance Dashboard
        • DAY TRADING
          • Watch List
        • ATGL DASHBOARD
        • ETF STRATEGIES
          • ETF Sector Rotation
          • ETF Sector Portfolio
        • DIVIDEND GROWTH
          • Dividend Growth Portfolio
          • Dividend Calendar
        • DOGS OF THE DOW
          • Dogs of the Dow Portfolio
          • DOW 5 Portfolio
  • Markets
        • US MARKET
          • Commodities
          • Energy
          • Precious Metals
          • Volatility
        • GLOBAL MARKETS
          • Market Indices
          • Economic Calendar
          • FOREX Heat Map
          • FOREX Cross Rates
          • Crypto Currency Market
  • Investing
    • Discord Community
    • Dashboard
  • Resources
        • ARTICLES
          • Dividend Growth Model Articles
          • ETF Articles
          • Investment Strategies Articles
          • Market and Economic Insights
          • Stock Trade Articles
          • Stock Reviews
        • TOOLS
          • Stock Scanners
          • Charting Software
          • Brokerage Firms
        • STOCK CHARTS
          • Key Components
          • Reading Charts
          • Drawing Stock Charts
          • Identifying Trends
        • RETIREMENT PLANNING
  • About
    • Contact Us
    • How to Win
    • #1 At Stockcharts
    • Disclaimer
    • FAQ
  • Log In
  • Subscribe

March 5, 2017

Weekly Commentary Mar 5, 2017

Dollar Chart
Will the US Dollar FAIL this time up?


03/05/2017:  Markets were up over 1/2% for the week, as the Indices were able to bounce again at the Pink Lines (10-day avgs.) Falling Below the Pink Lines should create Short Term Sell Signals.

The Indices are very over-bought, and are stretched Way Above the Green Line. Eventually the Markets will return down to the Green Lines (like they always do), Maybe a pull-back after the FED probably RAISES short term Interest Rates on Mar 15.

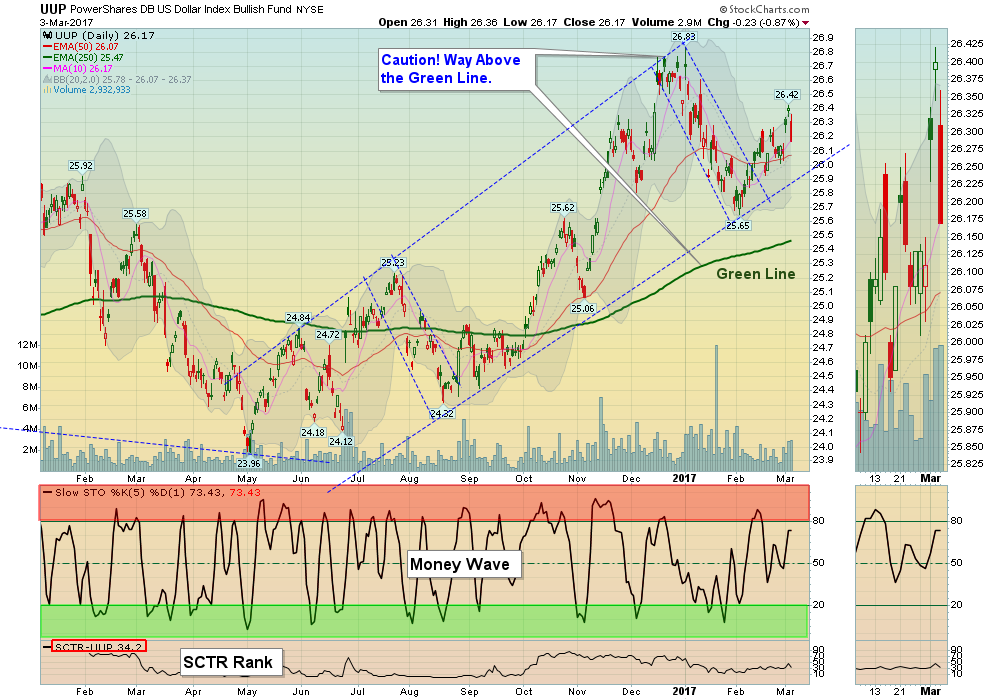
The US Dollar is re-testing the January Highs… A FAILURE to make new Highs would be Bullish for GOLD and Commodities (but the Dollar is currently rallying on FED RAISE soon.)

There should always be Investments going up EVERY YEAR that meet the Green Line Rules. Raise some CASH, and wait… there will be some BAD NEWS, and we will be ready to BUY!


MONEY WAVE BUYS SOON:    There are 7 Open Positions,  and 4 Investments are on the Watch List.

ON DECK to Buy soon: ARNC   ARCONIC INC,   CLF  CLIFFS NAT’L RES.     NFLX   NETFLIX INC,   PIP  PHARM ATHENE.  Wait for GREEN ZONE BUYS.  We will email or text when they are ready.  


LONG TERM TRADES – We are looking for a good Entry Point for these, which could possible Double:

AXAS    ABRAXIS PETE.   Waiting to see if it will hold Above the Green Line.

JJC     COPPER FUND           Weekly Red Zone. Waiting on a Pull-back.

KOL    COAL FUND     Waiting for a Pull-back.

MDR    MCDERMOTT INT’L.  Waiting for a Pull-back


Click for  Open Positions   

Click for  Closed Positions

Alert! Market Risk HIGH (Red Zone). The probability of successful Short Term Trades is lower, when the S&P 500 is Way Above the Green Line. Even the Strongest Funds can get chopped up. Either take quick gains from Money Wave Pops, or STAY IN CASH & WAIT for a larger correction.

[s_static_display]

Tell your Friend about us, and HELP ANIMALS.


We had our first Chat Room Session on Saturday morning… Positive comments. Many are having trouble logging in, and we are working on that. Thank you for your patience.

QUESTION:  Marc M writes “this GOLD chart is disturbing..Don’t you think?”
Marc

ANSWER:

Thank you for writing, Marc.

Gold could be doing Wave 2 down, but it must hold above the 62% Retracement Level around $1185 (or $112.17 on GLD Chart.  The US Dollar might Fail to make Highs soon, after the FED raise on Mar 15.
Good trading, and tell your friends!

Related Post

– Weekly Commentary Feb 26, 2017

Subscribe to Our Newsletter

AGL Logo

Get our eBook Now!

Candlestick - A Swing Traders Friend

We don’t spam! Read our privacy policy for more info.

You’ve been successfully subscribed to our newsletter!

Voted #1 at Stock Charts

SH Chart
Inverse S&P 500 Fund (SH) will have a Money Wave Buy today.

Help Us Help Animals

Help Us Help Animals

Recent Comments

  • Market Breadth Indicators: A Trader’s Guide to Early Trend Detection on Backtesting: Definition and How a Trading Strategy Backtest Works
  • Island Reversal Pattern: Definition and Formation Explained on Double Top Pattern: How to Identify and Trade This Reversal Signal
  • Channel Pattern Guide: What It Is and Why It Matters on A Guide to Forecasting Using Moving Averages
  • What Is a Broadening Bottom Chart Pattern? Full Guide on Bull vs. Bear Market: An Investor’s Guide to Market Phases
  • ATGL Weekly Money Flow - 2025-05-11 on ATGL Top Pick of the Week! Apr 6, 2025

Become a Green Liner!

Help me make more Money in the Stock Market.

ON ATGL

  • DashBoard
  • Weekly Commentary
  • Daily Buy / Sell Signals
  • Day Trade Setup
  • Trading Rooms

Design & Develop By Pixelvect

STRATEGIES

  • Swing Trading
  • ATGL Pick of the Week
  • Dividend Growth
  • ETF Sector Rotation
  • Dogs of the Dow

HELP

  • ATGL Trading Rules
  • FAQ
  • Account Maintenance
  • Contact US
  • Join

FOLLOW US

Instagram Linkedin Twitter Facebook

© COPYRIGHT 2024 · ABOVETHEGREENLINE.COM · ALL RIGHTS RESERVED · PRIVACY · TERMS · CONTACT · WATCHLIST · CURRENT