Above the Green Line -01
  • Market Insights
        • Commentary
          • Daily
          • Weekly
        • BUY / SELL SIGNALS
          • Trade Posts
          • Recent Trade Alerts
          • Recent Day Trades
        • BLOGROLL
          • Dividend Growth Blog
          • ETF Sector Blog
          • Dow Dogs
          • TPOW Blog
  • Strategies
        • SWING TRADING
          • Current Positions
          • Watchlists
          • Closed Positions
          • Candidates - TOP 100
          • Specialty Stocks
        • WEEKLY STOCK PICK
          • TPOW Charts
          • TPOW Performance
          • TPOW Strategy Guide
          • TPOW Performance Dashboard
        • DAY TRADING
          • Watch List
        • ATGL DASHBOARD
        • ETF STRATEGIES
          • ETF Sector Rotation
          • ETF Sector Portfolio
        • DIVIDEND GROWTH
          • Dividend Growth Portfolio
          • Dividend Calendar
        • DOGS OF THE DOW
          • Dogs of the Dow Portfolio
          • DOW 5 Portfolio
  • Markets
        • US MARKET
          • Commodities
          • Energy
          • Precious Metals
          • Volatility
        • GLOBAL MARKETS
          • Market Indices
          • Economic Calendar
          • FOREX Heat Map
          • FOREX Cross Rates
          • Crypto Currency Market
  • Investing
    • Discord Community
    • Dashboard
  • Resources
        • ARTICLES
          • Dividend Growth Model Articles
          • ETF Articles
          • Investment Strategies Articles
          • Market and Economic Insights
          • Stock Trade Articles
          • Stock Reviews
        • TOOLS
          • Stock Scanners
          • Charting Software
          • Brokerage Firms
        • STOCK CHARTS
          • Key Components
          • Reading Charts
          • Drawing Stock Charts
          • Identifying Trends
        • RETIREMENT PLANNING
  • About
    • Contact Us
    • How to Win
    • #1 At Stockcharts
    • Disclaimer
    • FAQ
  • Log In
  • Subscribe

January 22, 2017

Weekly Commentary Jan 22, 2017

Dow is Way Above the Green Line.


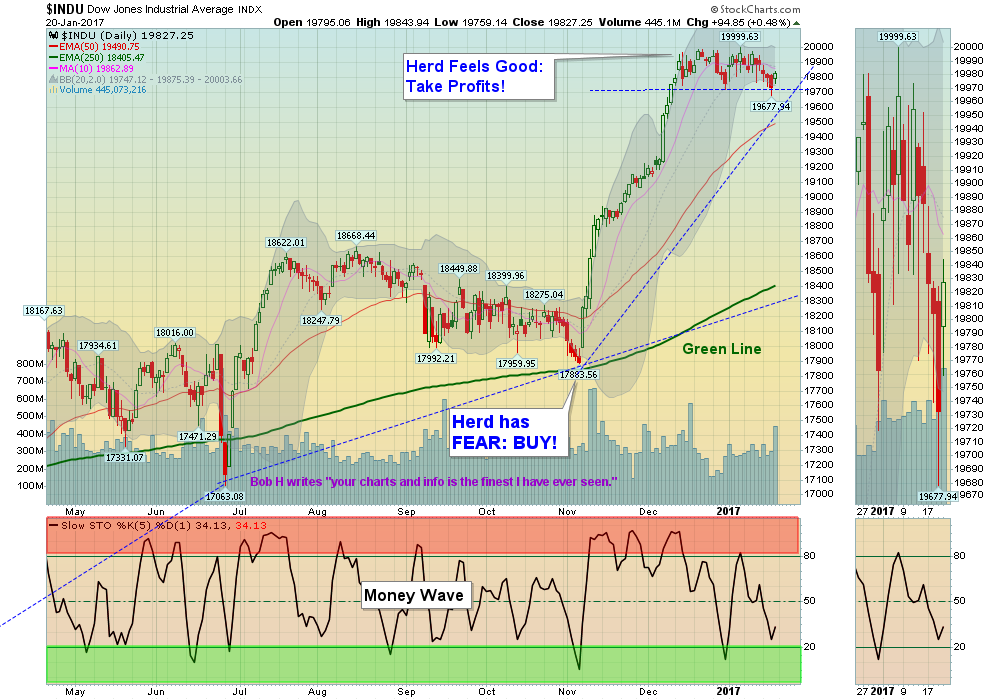
01/22/2017:  The Markets were down slightly this week, extending the sideways action for  the 6th week. Most of the Trump Rally gains happened the first 3 weeks after the Election Nov. 8th. Good trades happen when Markets become Over-Sold, like on November 7th. Expecting large trading profits now, without a decent pull-back is not realistic.

Recent Money Wave Buys have been triggered, and many are getting Stopped Out quickly. The bounces are poor from lack of Buyers. Most HOPEFUL Investors are now IN the Markets and they FEEL GOOD!  But Wise Investors TAKE PROFITS when the HERD FEELS GOOD.   

Just control your EMOTIONS, and WAIT FOR IT. Train yourself to BUY BAD, SELL GOOD!    

MONEY WAVE BUYS SOON:    There are currently 11 Open Positions.

ON DECK to Buy soon: GS   PIR  & RSX   Wait for GREEN ZONE BUYS.  We will email or text when they are ready.


LONG TERM TRADES – We are looking for a good Entry Point for these, which could Double:

UGA  US GASOLINE FUND   The Daily UGA Chart is in the Green Zone for a Buy Signal soon.

CDE    COEUR MINING

MDR    MCDERMOTT INT’L.

Please view the WATCH LIST  for pending Money Wave Buys.
Wait for Money Wave Buy Signals.  We will email you when they are ready.  

Click for  Open Positions   

Click for  Closed Positions

Alert! Market Risk HIGH (Red Zone). The probability of successful Short Term Trades is lower, when the S&P 500 is Way Above the Green Line. Even the Strongest Funds can get chopped up. Either take quick gains from Money Wave Pops, or STAY IN CASH & WAIT for a larger correction.

[s_static_display]

Tell your Friend about us, and HELP ANIMALS.


QUESTION: Don writes” To have a Money Wave Buy, do the moving averages need to be aligned? Does the 50 need to be above the 200, and the 10 above the 50?”

ANSWER:  Please read and follow the Green Line RULES for best results…

1. Investment must be Above the Green Line (250-day moving average).
2. Investment must have Above 90 Relative Strength.
3. Money Wave Buy (Money Wave Indicator Closing > 20 and OUT of Green Zone.)

Thank you for your question.

Related Post

– Weekly Commentary Jan 15, 2017

Subscribe to Our Newsletter

AGL Logo

Get our eBook Now!

Candlestick - A Swing Traders Friend

We don’t spam! Read our privacy policy for more info.

You’ve been successfully subscribed to our newsletter!

Voted #1 at Stock Charts

SH Chart
Inverse S&P 500 Fund (SH) will have a Money Wave Buy today.

Help Us Help Animals

Help Us Help Animals

Recent Comments

  • Market Breadth Indicators: A Trader’s Guide to Early Trend Detection on Backtesting: Definition and How a Trading Strategy Backtest Works
  • Island Reversal Pattern: Definition and Formation Explained on Double Top Pattern: How to Identify and Trade This Reversal Signal
  • Channel Pattern Guide: What It Is and Why It Matters on A Guide to Forecasting Using Moving Averages
  • What Is a Broadening Bottom Chart Pattern? Full Guide on Bull vs. Bear Market: An Investor’s Guide to Market Phases
  • ATGL Weekly Money Flow - 2025-05-11 on ATGL Top Pick of the Week! Apr 6, 2025

Become a Green Liner!

Help me make more Money in the Stock Market.

ON ATGL

  • DashBoard
  • Weekly Commentary
  • Daily Buy / Sell Signals
  • Day Trade Setup
  • Trading Rooms

Design & Develop By Pixelvect

STRATEGIES

  • Swing Trading
  • ATGL Pick of the Week
  • Dividend Growth
  • ETF Sector Rotation
  • Dogs of the Dow

HELP

  • ATGL Trading Rules
  • FAQ
  • Account Maintenance
  • Contact US
  • Join

FOLLOW US

Instagram Linkedin Twitter Facebook

© COPYRIGHT 2024 · ABOVETHEGREENLINE.COM · ALL RIGHTS RESERVED · PRIVACY · TERMS · CONTACT · WATCHLIST · CURRENT