Above the Green Line -01
  • Market Insights
        • Commentary
          • Daily
          • Weekly
        • BUY / SELL SIGNALS
          • Trade Posts
          • Recent Trade Alerts
          • Recent Day Trades
        • BLOGROLL
          • Dividend Growth Blog
          • ETF Sector Blog
          • Dow Dogs
          • TPOW Blog
  • Strategies
        • SWING TRADING
          • Current Positions
          • Watchlists
          • Closed Positions
          • Candidates - TOP 100
          • Specialty Stocks
        • WEEKLY STOCK PICK
          • TPOW Charts
          • TPOW Performance
          • TPOW Strategy Guide
          • TPOW Performance Dashboard
        • DAY TRADING
          • Watch List
        • ATGL DASHBOARD
        • ETF STRATEGIES
          • ETF Sector Rotation
          • ETF Sector Portfolio
        • DIVIDEND GROWTH
          • Dividend Growth Portfolio
          • Dividend Calendar
        • DOGS OF THE DOW
          • Dogs of the Dow Portfolio
          • DOW 5 Portfolio
  • Markets
        • US MARKET
          • Commodities
          • Energy
          • Precious Metals
          • Volatility
        • GLOBAL MARKETS
          • Market Indices
          • Economic Calendar
          • FOREX Heat Map
          • FOREX Cross Rates
          • Crypto Currency Market
  • Investing
    • Discord Community
    • Dashboard
  • Resources
        • ARTICLES
          • Dividend Growth Model Articles
          • ETF Articles
          • Investment Strategies Articles
          • Market and Economic Insights
          • Stock Trade Articles
          • Stock Reviews
        • TOOLS
          • Stock Scanners
          • Charting Software
          • Brokerage Firms
        • STOCK CHARTS
          • Key Components
          • Reading Charts
          • Drawing Stock Charts
          • Identifying Trends
        • RETIREMENT PLANNING
  • About
    • Contact Us
    • How to Win
    • #1 At Stockcharts
    • Disclaimer
    • FAQ
  • Log In
  • Subscribe

April 1, 2017

Weekly Commentary for Apr 1, 2017

SPX Chart
Trump Rally since Nov. 8th 2017.


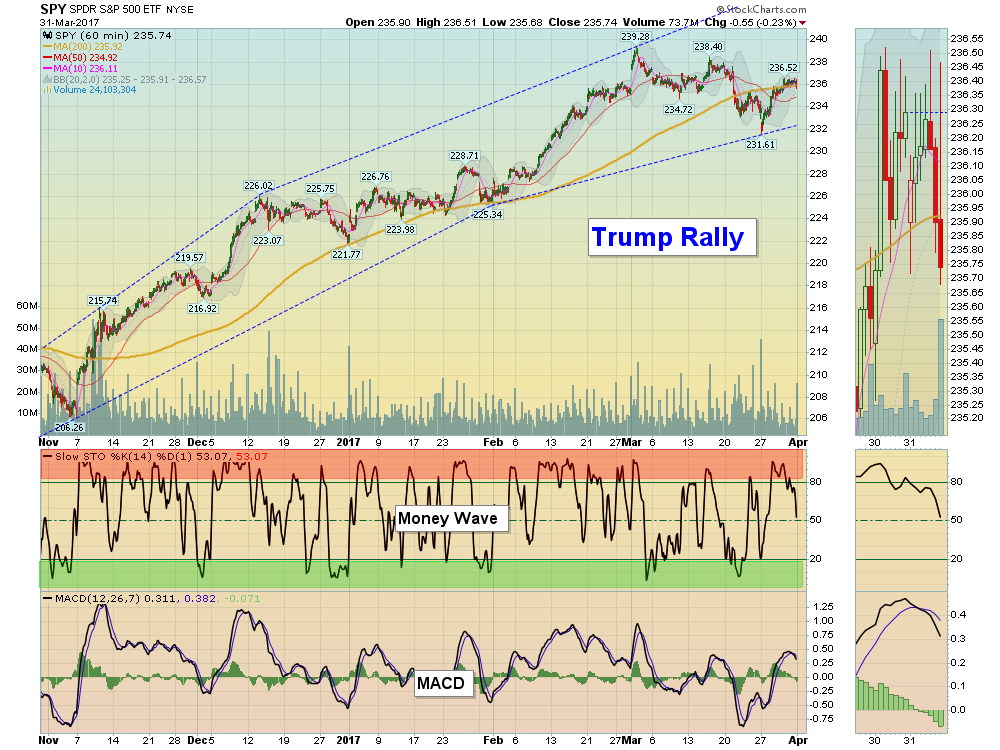
04/01/2017:  REALITY CHECK TIME. Since the Trump Rally began on Nov 8th (or when the Market bounced off the Green Line), the S&P 500 is up 10.8%. If you are expecting more upside on the Markets without a pull-back, you will probably be disappointed.

The most recent Money Wave Pops this week have been small, because most of the Buyers are in the Markets… Their Money has been placed. There is not an Unlimited amount of Money, because the Professionals will take profits and try to make more by trading the Over-Bought zigzags.  

You should look forward to a Correction, so the Money Wave Pops will be larger again.

Since the Trump Rally began, we have completed 40 Short Term trades,  averaging 2.26% per trade, with 23 wins & 17 losses.

The Long Term Portfolio is struggling, as the Herd continues to pile in the favorite companies selling at 5-10 times Book Value. They won’t touch the discounted Tangible sectors like Steel, Oil, & Copper companies, of which many are selling at or below Book Value (until Inflation finally comes back). 


Markets were up for the week, as the major Indices bounced off of the Red Lines, and are going back up to re-test the early March highs.  The Financials might not make it back up, indicating a Correction soon.

Crude OIL was up 5% for the week, as it bounced at the Green Line. Oil needs to Close above $55.24 for a Bull to begin.


MONEY WAVE BUYS SOON:    There are 9 Open Positions,  and 3 Investments are on the Watch List.

ON DECK to Buy soon:  CLVS   CLOVIS ONCOLOGY,   ESPR   ESPERION THERA,  &, INCY   INCYTE CORP.

Wait for GREEN ZONE BUYS.  We will email or text when they are ready.  


LONG TERM TRADES – We are looking for a good Entry Point for these, which could possible Double:

IPI    INTREPID POTASH    Waiting for Break Out Above $3.04.
JJC     COPPER FUND            Waiting on a Pull-back.
KOL    COAL FUND         Waiting for a Pull-back.
MDR    MCDERMOTT INT’L.  Waiting for Bounce Up.


Click for  Portfolio (Open Positions)  
Click for  Watch List
Click for  Closed Positions

Alert! Market Risk HIGH (Red Zone). The probability of successful Short Term Trades is lower, when the S&P 500 is Way Above the Green Line. Even the Strongest Funds can get chopped up. Either take quick gains from Money Wave Pops, or STAY IN CASH & WAIT for a larger correction.

[s_static_display]

Tell your Friend about us, and HELP ANIMALS.

Related Post

– Weekly Commentary Mar 26, 2017

Subscribe to Our Newsletter

AGL Logo

Get our eBook Now!

Candlestick - A Swing Traders Friend

We don’t spam! Read our privacy policy for more info.

You’ve been successfully subscribed to our newsletter!

Voted #1 at Stock Charts

SH Chart
Inverse S&P 500 Fund (SH) will have a Money Wave Buy today.

Help Us Help Animals

Help Us Help Animals

Recent Comments

  • Market Breadth Indicators: A Trader’s Guide to Early Trend Detection on Backtesting: Definition and How a Trading Strategy Backtest Works
  • Island Reversal Pattern: Definition and Formation Explained on Double Top Pattern: How to Identify and Trade This Reversal Signal
  • Channel Pattern Guide: What It Is and Why It Matters on A Guide to Forecasting Using Moving Averages
  • What Is a Broadening Bottom Chart Pattern? Full Guide on Bull vs. Bear Market: An Investor’s Guide to Market Phases
  • ATGL Weekly Money Flow - 2025-05-11 on ATGL Top Pick of the Week! Apr 6, 2025

Become a Green Liner!

Help me make more Money in the Stock Market.

ON ATGL

  • DashBoard
  • Weekly Commentary
  • Daily Buy / Sell Signals
  • Day Trade Setup
  • Trading Rooms

Design & Develop By Pixelvect

STRATEGIES

  • Swing Trading
  • ATGL Pick of the Week
  • Dividend Growth
  • ETF Sector Rotation
  • Dogs of the Dow

HELP

  • ATGL Trading Rules
  • FAQ
  • Account Maintenance
  • Contact US
  • Join

FOLLOW US

Instagram Linkedin Twitter Facebook

© COPYRIGHT 2024 · ABOVETHEGREENLINE.COM · ALL RIGHTS RESERVED · PRIVACY · TERMS · CONTACT · WATCHLIST · CURRENT