Above The Green Line

  • Commentary
    • BUY / SELL SIGNALS
      • Stock Alerts
    • DIVGRO BLOG
    • ETF SECTOR BLOG
    • DOW DOGS BLOG
    • NEWS
    • STOCK IDEAS
  • Strategies
    • SWING TRADING
      • CURRENT POSITIONS
      • WATCHLISTS
      • CLOSED POSITIONS
      • CANDIDATES – TOP 100
      • SPECIALTY STOCKS
    • DAY TRADING
      • Watch List
    • DIVIDEND GROWTH
      • Dividend Growth Portfolio
      • Dividend Calendar
    • DOGS OF THE DOW
      • Dogs of the Dow Portfolio
      • DOW 5 Portfolio
    • ETF SECTOR ROTATION
      • ETF Sector Portfolio
  • Markets
    • US MARKET
      • Commodities
      • Energy
      • Precious Metals
      • Volatility
    • GLOBAL MARKETS
      • MARKET INDICES
      • ECONOMIC CALENDAR
      • FOREX HEAT MAP
      • FOREX CROSS RATES
      • CRYPTOCURRENCY MARKET
    • DASHBOARD
    • IDEAS
  • Investing
    • FORUM
  • Resources
    • ARTICLES
    • WEEKLY STOCK
    • RETIREMENT PLANNING
    • BLOGROLL
    • FAQ
  • About
    • CONTACT US
    • HOW TO WIN
    • #1 AT STOCKCHARTS
  • Log In
  • Subscribe

September 27, 2016

Tuesday Sep 27, 2016

Money Wave Buys soon!


09/27 /2016:  Markets were up today, as the S&P 500 wants to re-test the August Highs of 2194.
If the S&P 500 does not blow thru the August highs, the Markets could be in trouble. Support is 2119 on the S&P 500.

Current Open Positions

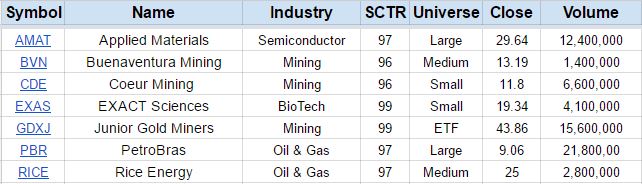
Money Wave Buys soon for  AMAT  BVN  CDE  EXAS  GDXJ PBR RICE  We will email you when they are ready.

Charts for Leaders     Watch List Page    Closed Positions.

Alert! Market Risk High (Red Zone). The probability of successful Short Term Trades is lower, when the S&P 500 is Way Above the Green Line. Even the Strongest Funds can get chopped up. Either take quick gains from Money Wave Pops, or STAY IN CASH & WAIT for a larger correction.

Posted By AbovetheGreenLine at 9:02 pm 2 Comments

Comments

  1. Bartthehumble1 says

    September 28, 2016 at 7:17 am

    When I clicked on the “Current Open Positions”, AMD, it opened right up to the graph showing it’s performance. The only thing now showing is the recommendations shown at the bottom. I believe that the last comment is to “sell if it drops below the pink line”.

    I went back out to Stock Charts, opened up the Public Chart list, etc. and found the recommendation. Is there a possibility in the future that when I click on Current Open Positions, that the comments will be there? I am very happy to have subscribed to Above the Green Line, and am taking your advice to be careful and wait.

    Log in to Reply
    • AbovetheGreenLine says

      September 28, 2016 at 9:18 am

      OK Steve, comment has been added to Open Positions spread sheet.

      Thank you for your input.

      9/15/2016 AMD $6.02 $6.30 6.59 Money Wave in the Red Zone. Sell Below Pink Line

      Log in to Reply

Leave a Reply Cancel reply

You must be logged in to post a comment.

Voted #1 at Stock Charts

SH Chart
Inverse S&P 500 Fund (SH) will have a Money Wave Buy today.

Help Us Help Animals

Help Us Help Animals

Recent Comments

  • Green Line Weekly! Aug 7, 2022 – ParkRiver on Green Line Weekly! Aug 7, 2022
  • AbovetheGreenLine on Money Wave Alert! Aug 5, 2022
  • merryme on Money Wave Alert! Aug 5, 2022
  • AbovetheGreenLine on Target was Hit on CTIC for an 8.9% Gain.
  • SlippinJimmy on Target was Hit on CTIC for an 8.9% Gain.

Become a Green Liner!

Help me make more Money in the Stock Market.

Above the Green Line

ON ATGL

  • Weekly Commentary
  • Intraday Buy / Sells
  • Day Trade Setup

STRATEGIES

  • Swing Trading
  • Dividend Growth
  • ETF Sector Rotation
  • Dogs of the Dow

HELP

  • ATGL Trading Rules
  • FAQ
  • Account Maintenance
  • Contact US

© Copyright 2021 · AboveTheGreenLine.com · All Rights Reserved · Privacy · Terms · Contact · WatchList · Current