
10/25/2016: Stock Markets were down slightly today, as most Leaders are up in the Red Zones (probably too late to Buy for the Short Term).
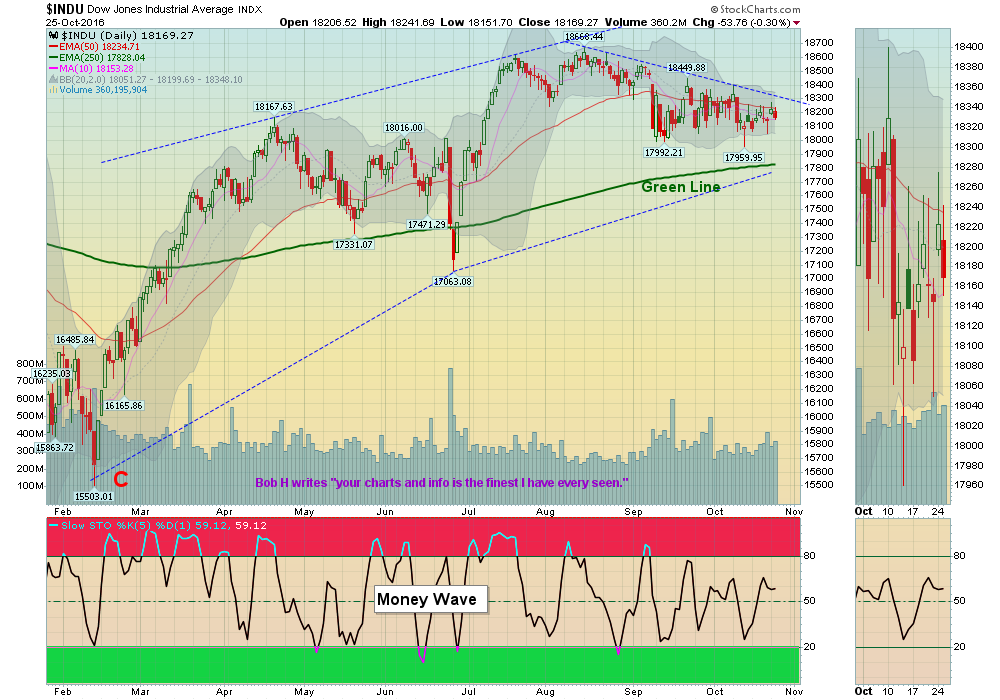
The DOW is correcting sideways, and looks like it might burp back up again before the Election.
Bonds are Low, and the Dollar is High, as most are betting on a FED Hike in December.
Money Waves Buys soon for ECA PE SRPT YELP . We will email you when they are ready. Watch List
Current Open Positions Closed Positions Charts for Leaders
Alert! Market Risk Medium (Yellow Zone). The probability of successful Short Term Trades is lower, when the S&P 500 is Way Above the Green Line. Even the Strongest Funds can get chopped up. Either take quick gains from Money Wave Pops, or STAY IN CASH & WAIT for a larger correction.
I was thinking it would be nice to have some running statistics in the closed trades section. Can be simple like summary at the end of each quarter that tracks cumulative gains , % gain/loss, assuming each trade is equal weighted. Or making the formate easy to export to an excell spreadsheet as I don’t seem to be able to do that.
thanks
Thank you for your input.
On the main Menu of the web site
Under “Closed Positions” tab, you will find a different format
with the ability to export data to Excel spreadsheet.
Good trading, and tell you friends!
Got it…thanks.
Markets look to be heading to recent lows of the range…could get interesting if it breaks trend line. I also saw you had UNG on the watchlist but took it off. Dec futures are correcting toward spot prices as winter is starting out warmer than prior expectations. Spot prices should set a lower boundary and then a asymetric winter trade could develop that could fit the momentum swing Above the green line would look for.
Yes, UNG fell Below the Green Line, and Below 90 Relative Strength.
But it had a big % Gain from Mar Low of $5.78 to recent $9.64 High.