
Above the Green Line presents both daily and weekly posts to its members highlighting Investment News and Trade alerts.
Money Wave Alert! May 17, 2024
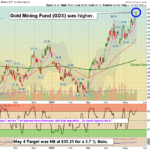
5/17/2024 Markets were mixed again today after Bonds pulled back down slightly. Gold $ Silver stocks shot up as many worry that more FED Printing later this year will increase Inflation. The Leaders & Techs are up in the Red Zones (probably … [Read more...]
Money Wave Alert! May 16, 2024
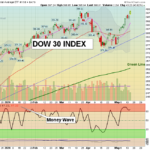
5/16/2024 Markets were mixed today after yesterday's big gain. Bonds struggled, so the Markets had no fuel to go higher. The Leaders & Techs are up in the Red Zones (probably too late to Buy for the short term). The GREED Index made another new … [Read more...]
Money Wave Alert! May 15, 2024
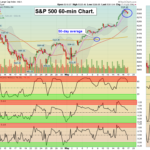
5/15/2024 Markets Gapped Up higher today, as the MEDIA told us that 3.4 % Inflation was Good News. Several Indices were able to make higher highs than March. Bonds were stronger, but the Leaders & Techs are not coming down from the Red Zones … [Read more...]
Money Wave Alert! May 14, 2024
5/14/2024 Markets were higher today, and the stronger S&P 500 Index was able to go higher than on Monday. Bonds were stronger, and the Indices are trying to go higher than in March, The Leaders & Techs are not coming down from the Red Zones … [Read more...]
Money Wave Alert! May 13, 2024
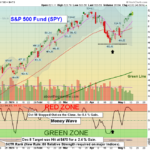
5/13/2024 Markets were slightly lower again today, and the stronger S&P 500 Index was not able to go higher than yesterday. Bonds were weaker, and the Leaders & Techs are still coming down from the Red Zones (probably too late to Buy for the … [Read more...]
- « Previous Page
- 1
- …
- 91
- 92
- 93
- 94
- 95
- …
- 486
- Next Page »