
Above the Green Line presents both daily and weekly posts to its members highlighting Investment News and Trade alerts.
Money Wave Alert! Jun 14, 2024
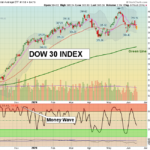
6/14/2024 Markets were mostly lower today on mild profit taking form this week's rally. The S&P 500 and NASDAQ 100 Indices are still sitting up on highs with the help of the Big 7 Stocks. Many investors are betting that the FED will see the … [Read more...]
Money Wave Alert! Jun 13, 2024
6/13/2024 Markets were mostly higher today on weaker Inflation news. The S&P 500 and NASDAQ 100 Indices Gapped Up to new highs again today on panic Good News Buying. Many investors are betting that the FED will see the Economic weakness, and … [Read more...]
Money Wave Alert! Jun 12, 2024
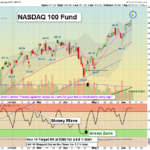
6/12/2024 Markets were higher today on hopes that Inflation has peaked. The S&P 500 and NASDAQ 100 Indices Gapped Up to new highs on panic Good News Buying, but the Volume was not good. The FED did not Cut Rates after their meeting today, as … [Read more...]
Money Wave Alert! Jun 11, 2024
6/11/2024 Markets were mixed today after selling off in the morning. The S&P 500 and NASDAQ 100 Indices are back up near the highs, but are struggling to advance more. Many investors are betting that the FED will see the Economic weakness, and … [Read more...]
Money Wave Alert! Jun 10, 2024
6/10/2024 Markets were slightly higher today on low Buying Volume. The S&P 500 and NASDAQ 100 Indices are struggling to advance after making higher highs last week (Bullish). Many investors are betting that the FED will see the Economic … [Read more...]
- « Previous Page
- 1
- …
- 87
- 88
- 89
- 90
- 91
- …
- 486
- Next Page »