
Above the Green Line presents both daily and weekly posts to its members highlighting Investment News and Trade alerts.
Money Wave Alert! June 24, 2024
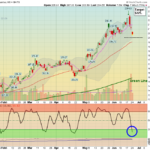
6/24/2024 The Dow advanced 328 points, or 0.8%. The S&P 500 added 0.3%, while the tech-heavy NASDAQ Composite declined 0.3%. NVDIA fell 5%, adding to its 4% decline last week that snapped an eight-week winning streak. The pullback … [Read more...]
Money Wave Alert! June 21, 2024
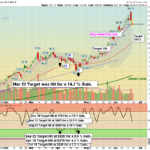
6/21/2024 The S&P 500 is coming off a losing session after hitting an intraday record of 5,505.53, but headed for a 0.6% weekly advance. The Nasdaq is tracking for a 0.1% weekly gain, while the Dow is the outperformer, touting a 1.4% … [Read more...]
Money Wave Alert! Jun 20, 2024
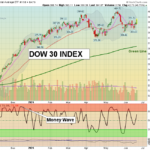
6/20/2024 Markets were mixed again today as the 30-DOW stocks were higher, but the Techs & Big 7 Stocks stalled. The Semis made new highs in the morning, and then sold off. There are very few Sellers today as FOMO (Fear of Missing … [Read more...]
Money Wave Alert! Jun 18, 2024
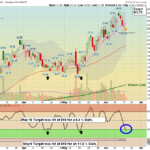
MARKETS WILL BE CLOSED TOMORROW FOR FEDERAL HOLIDAY. 6/18/2024 Markets were mixed to higher today as the Big 7 Stocks stalled, but the Semis made new highs. There are very few Sellers today as FOMO (Fear of Missing Out) has taken over, … [Read more...]
Money Wave Alert! Jun 17, 2024
6/17/2024 Markets were higher today as the Big 7 Stocks surged up to new highs. There are very few Sellers today as FOMO (Fear of Missing Out) has taken over, and Smart Money has stepped back to wait for the Climax. Many investors are betting that … [Read more...]
- « Previous Page
- 1
- …
- 86
- 87
- 88
- 89
- 90
- …
- 486
- Next Page »