Above the Green Line -01
  • Market Insights
        • Commentary
          • Daily
          • Weekly
        • BUY / SELL SIGNALS
          • Trade Posts
          • Recent Trade Alerts
          • Recent Day Trades
        • BLOGROLL
          • Dividend Growth Blog
          • ETF Sector Blog
          • Dow Dogs
          • TPOW Blog
  • Strategies
        • SWING TRADING
          • Current Positions
          • Watchlists
          • Closed Positions
          • Candidates - TOP 100
          • Specialty Stocks
        • WEEKLY STOCK PICK
          • TPOW Charts
          • TPOW Performance
          • TPOW Strategy Guide
          • TPOW Performance Dashboard
          • Why Weekly Trading Works
        • DAY TRADING
          • Watch List
        • ATGL DASHBOARD
        • ETF STRATEGIES
          • ETF Sector Rotation
          • ETF Sector Portfolio
        • DIVIDEND GROWTH
          • Dividend Growth Portfolio
          • Dividend Calendar
        • DOGS OF THE DOW
          • Dogs of the Dow Portfolio
          • DOW 5 Portfolio
  • Markets
        • US MARKET
          • Commodities
          • Energy
          • Precious Metals
          • Volatility
        • GLOBAL MARKETS
          • Market Indices
          • Economic Calendar
          • FOREX Heat Map
          • FOREX Cross Rates
          • Crypto Currency Market
  • Investing
    • Discord Community
    • Dashboard
  • Resources
        • INVESTING GUIDES
          • Dividend Growth Guide
          • Investment Strategy Framework
          • ETF Investing Handbook
          • Stock Trading Handbook
        • ARTICLES
          • Dividend Growth Model Articles
          • ETF Articles
          • Investment Strategies Articles
          • Market and Economic Insights
          • Stock Trade Articles
          • Stock Reviews
        • TOOLS
          • Stock Scanners
          • Charting Software
          • Brokerage Firms
          • Stocks We Review
        • STOCK CHARTS
          • Key Components
          • Reading Charts
          • Drawing Stock Charts
          • Identifying Trends
  • About
    • Contact Us
    • How to Win
    • #1 At Stockcharts
    • Disclaimer
    • FAQ
  • Log In
  • Subscribe

Trade Signals

Above the Green Line presents both daily and weekly posts to its members highlighting Investment News and Trade alerts.

August 12, 2024

Money Wave Alert! Aug 12, 2024

QQQ chart

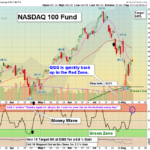
8/12/2024 The Markets were mixed to lower  today, but the Big Techs rallied. Many stocks have quickly become over bought on the short term (Red Zone on daily Money Wave). The Watch List is smaller, so maybe a small pull back soon. Wait for … [Read more...]

August 9, 2024

Money Wave Alert! August 9, 2024

8/09/2024 The S&P 500 was flat on Friday as the stock market’s incredible comeback from Monday’s violent rout faltered a tad. The benchmark was close to wiping out its losses for the week. This week marked the most volatile week of 2024 for the … [Read more...]

August 8, 2024

Money Wave Alert! August 8, 2024

8/08/2024 Stocks climbed Thursday after new labor market data boosted investors’ confidence in the U.S. economy following a sharp market sell-off earlier in the week. The latest weekly jobless claims came in below forecasts, helping to allay some … [Read more...]

August 7, 2024

Money Wave Alert! August 7, 2024

8/07/2024 Stocks climbed Wednesday for a while, then stalled out. Apple and Microsoft advanced more than 2% and 1%, respectively. Chipmaker Advanced Micro Devices gained nearly 2%. Meanwhile, Nvidia pulled back 3.7%, and shares of Super Micro … [Read more...]

August 6, 2024

Money Wave Alert! August 6, 2024

8/06/2024 Stocks jumped Tuesday, recovering some some losses from the previous trading session. The S&P 500 traded 2.1% higher. The Dow Jones Industrial Average rose over 500 points, and the tech-heavy Nasdaq Composite gained over 2%. All eleven … [Read more...]

  • « Previous Page
  • 1
  • …
  • 79
  • 80
  • 81
  • 82
  • 83
  • …
  • 486
  • Next Page »

Subscribe to Our Newsletter

AGL Logo

Get our eBook Now!

Candlestick - A Swing Traders Friend

We don’t spam! Read our privacy policy for more info.

You’ve been successfully subscribed to our newsletter!

Voted #1 at Stock Charts

SH Chart
Inverse S&P 500 Fund (SH) will have a Money Wave Buy today.

Help Us Help Animals

Help Us Help Animals

Recent Comments

  • How to Use Net Present Value (NPV) for Dividend Stocks on How To Analyze Stocks With the Dividend Discount Model
  • How to Use Net Present Value (NPV) for Dividend Stocks on How To Develop an Effective Dividend Investing Strategy
  • How to Use Net Present Value (NPV) for Dividend Stocks on Why Is Time Value of Money Important for Investors
  • Free Cash Flow (FCF) Guide: Dividend Safety & Financial Strength on Dividend Payout Ratio: Definition, Formula, and Calculations
  • Dividend Payout Ratio: Definition, Formula, and Calculations on How To Analyze Stocks With the Dividend Discount Model

Become a Green Liner!

Help me make more Money in the Stock Market.

ON ATGL

  • DashBoard
  • Weekly Commentary
  • Daily Buy / Sell Signals
  • Day Trade Setup
  • Trading Rooms

Design & Develop By Pixelvect

STRATEGIES

  • Swing Trading
  • ATGL Pick of the Week
  • Dividend Growth
  • ETF Sector Rotation
  • Dogs of the Dow

HELP

  • ATGL Trading Rules
  • FAQ
  • Account Maintenance
  • Contact US
  • Join

FOLLOW US

Instagram Linkedin Twitter Facebook

© COPYRIGHT 2024 · ABOVETHEGREENLINE.COM · ALL RIGHTS RESERVED · PRIVACY · TERMS · CONTACT · WATCHLIST · CURRENT