Above the Green Line -01
  • Market Insights
        • Commentary
          • Daily
          • Weekly
        • BUY / SELL SIGNALS
          • Trade Posts
          • Recent Trade Alerts
          • Recent Day Trades
        • BLOGROLL
          • Dividend Growth Blog
          • ETF Sector Blog
          • Dow Dogs
          • TPOW Blog
  • Strategies
        • SWING TRADING
          • Current Positions
          • Watchlists
          • Closed Positions
          • Candidates - TOP 100
          • Specialty Stocks
        • WEEKLY STOCK PICK
          • TPOW Charts
          • TPOW Performance
          • TPOW Strategy Guide
          • TPOW Performance Dashboard
          • Why Weekly Trading Works
        • DAY TRADING
          • Watch List
        • ATGL DASHBOARD
        • ETF STRATEGIES
          • ETF Sector Rotation
          • ETF Sector Portfolio
        • DIVIDEND GROWTH
          • Dividend Growth Portfolio
          • Dividend Calendar
        • DOGS OF THE DOW
          • Dogs of the Dow Portfolio
          • DOW 5 Portfolio
  • Markets
        • US MARKET
          • Commodities
          • Energy
          • Precious Metals
          • Volatility
        • GLOBAL MARKETS
          • Market Indices
          • Economic Calendar
          • FOREX Heat Map
          • FOREX Cross Rates
          • Crypto Currency Market
  • Investing
    • Discord Community
    • Dashboard
  • Resources
        • INVESTING GUIDES
          • Dividend Growth Guide
          • Investment Strategy Framework
          • ETF Investing Handbook
          • Stock Trading Handbook
        • ARTICLES
          • Dividend Growth Model Articles
          • ETF Articles
          • Investment Strategies Articles
          • Market and Economic Insights
          • Stock Trade Articles
          • Stock Reviews
        • TOOLS
          • Stock Scanners
          • Charting Software
          • Brokerage Firms
          • Stocks We Review
        • STOCK CHARTS
          • Key Components
          • Reading Charts
          • Drawing Stock Charts
          • Identifying Trends
  • About
    • Contact Us
    • How to Win
    • #1 At Stockcharts
    • Disclaimer
    • FAQ
  • Log In
  • Subscribe

Trade Signals

Above the Green Line presents both daily and weekly posts to its members highlighting Investment News and Trade alerts.

October 4, 2024

Money Wave Alert! Oct 4, 2024

SPY chart

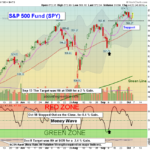
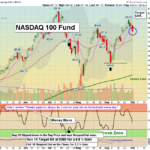
10/4/2024  The Markets were higher today on stronger Employment numbers.  The S&P 500 & NASDAQ 100 Funds were becoming over sold on the short term. Now the Indices need to go higher than last week for the rally to continue. The S&P 500 … [Read more...]

October 3, 2024

Money Wave Alert! Oct 3, 2024

EVGO chart

10/3/2024  The Markets were mostly lower today on continued FEAR with world affairs. The S&P 500 & NASDAQ 100 Funds are still below the Pink Lines (10-day avgs.) for short term Sell Signals. So fat the Selling has been mild, which is … [Read more...]

October 2, 2024

Money Wave Alert! Oct 2, 2024

CLOV chart

10/2/2024  The Markets were mixed today as FEAR is still higher on world affairs. The S&P 500 & NASDAQ 100 Funds both slipped below  the Pink Lines (10-day avgs.) for short term Sell Signals. But little Selling came in, which is … [Read more...]

October 1, 2024

Money Wave Alert! Oct 1, 2024

QQQ chart

10/1/2024  The Markets were lower today after Bad News on the Economy. The S&P 500 & NASDAQ 100 Funds are struggling to stay above the Pink Lines (10=day avgs.) to avoid short term Sell Signals. The Indices have not been able to go higher … [Read more...]

September 30, 2024

Money Wave Alert! Sep 30, 2024

BFLY Chart

9/30/2024  The Markets were mixed today after dropping in the morning. The S&P 500 & NASDAQ 100 Funds are bouncing at the Pink Lines (10=day avgs.) to avoid short term Sell Signals. The Indices are trying to go higher than last week. So … [Read more...]

  • « Previous Page
  • 1
  • …
  • 71
  • 72
  • 73
  • 74
  • 75
  • …
  • 486
  • Next Page »

Subscribe to Our Newsletter

AGL Logo

Get our eBook Now!

Candlestick - A Swing Traders Friend

We don’t spam! Read our privacy policy for more info.

You’ve been successfully subscribed to our newsletter!

Voted #1 at Stock Charts

SH Chart
Inverse S&P 500 Fund (SH) will have a Money Wave Buy today.

Help Us Help Animals

Help Us Help Animals

Recent Comments

  • How to Use Net Present Value (NPV) for Dividend Stocks on How To Analyze Stocks With the Dividend Discount Model
  • How to Use Net Present Value (NPV) for Dividend Stocks on How To Develop an Effective Dividend Investing Strategy
  • How to Use Net Present Value (NPV) for Dividend Stocks on Why Is Time Value of Money Important for Investors
  • Free Cash Flow (FCF) Guide: Dividend Safety & Financial Strength on Dividend Payout Ratio: Definition, Formula, and Calculations
  • Dividend Payout Ratio: Definition, Formula, and Calculations on How To Analyze Stocks With the Dividend Discount Model

Become a Green Liner!

Help me make more Money in the Stock Market.

ON ATGL

  • DashBoard
  • Weekly Commentary
  • Daily Buy / Sell Signals
  • Day Trade Setup
  • Trading Rooms

Design & Develop By Pixelvect

STRATEGIES

  • Swing Trading
  • ATGL Pick of the Week
  • Dividend Growth
  • ETF Sector Rotation
  • Dogs of the Dow

HELP

  • ATGL Trading Rules
  • FAQ
  • Account Maintenance
  • Contact US
  • Join

FOLLOW US

Instagram Linkedin Twitter Facebook

© COPYRIGHT 2024 · ABOVETHEGREENLINE.COM · ALL RIGHTS RESERVED · PRIVACY · TERMS · CONTACT · WATCHLIST · CURRENT