
Above the Green Line presents both daily and weekly posts to its members highlighting Investment News and Trade alerts.
Money Wave Alert! Nov 21, 2024
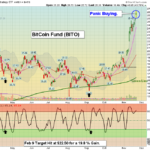
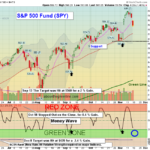
11/21/2024 The Markets were higher today as Sellers disappeared. The S&P 500 & NASDAQ 100 bounced up out of the Green Zones yesterday and should retest the recent highs. Bit-Coin Stocks are at MAX GREED Stage (Take Profits). Wait for … [Read more...]
Money Wave Alert! Nov 20, 2024
11/20/2024 The Markets were mostly lower today on war fears and mild selling. The S&P 500 & NASDAQ 100 bounced up out of the Green Zones yesterday (probably too late to Sell for the short term) but the follow thru Buying today was poor, as … [Read more...]
Money Wave Alert! Nov 19, 2024

11/19/2024 The Markets were mixed today as the S&P 500 & NASDAQ 100 are trying to bounce up out of the Green Zones (probably too late to Sell for the short term) for Buy Signals. But the Buying Volume was weak, as FOMO has faded. Wait for … [Read more...]
Money Wave Alert! Nov 18, 2024
The Top Pick of the Week - Cava GROUP $CAVA was bought on the Open today and should be sold on the Close Friday. 11/18/2024 The Markets were mostly higher today as the DOW 30 & NASDAQ 100 were down near the Green Zones (probably too late … [Read more...]
Money Wave Alert! Nov 15, 2024
The Top Pick of the Week - Under Armour $UAA should be sold on the Close today for a small Gain. 11/15/2024 The Markets were lower today as the DOW 30 & S&P 500 could not make higher highs, and rolled over (Double Top). Panic Buying is … [Read more...]
- « Previous Page
- 1
- …
- 64
- 65
- 66
- 67
- 68
- …
- 486
- Next Page »