
Above the Green Line presents both daily and weekly posts to its members highlighting Investment News and Trade alerts.
Money Wave Alert! Mar 24, 2025
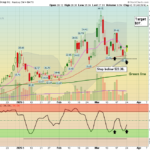
The Top Pick of the Week: Hims & Hers Health Inc $HIMS has been bought on the open today for a nice 8% bounce. March 24, 2025, The Nasdaq moved up today, showing strong market strength, and SPY also gapped up. The overall market started the … [Read more...]
Money Wave Alert! Mar 21, 2025
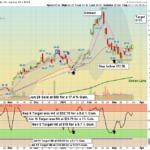
The Top Pick of the Week: ROBINHOOD MKTS $HOOD will be Sold on the Close today for a nice Gain. March 21, 2025, The Nasdaq moved down today, showing weakness across the market. SPY gapped down and did not look strong, struggling to recover. … [Read more...]
Money Wave Alert! Mar 20, 2025

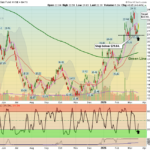
March 20, 2025, The Nasdaq moved up early today, showing steady bullish momentum across the market. The SPY is looking strong after making a higher high and retracing back to the Banana Line. Overall, markets are following SPY’s movement, indicating … [Read more...]
Money Wave Alert! Mar 19, 2025
March 19, 2025 The Nasdaq moved up again to Monday's high on decent Buying. The FED kept short term Interest Rates unchanged. The TPOW (Top Pick of the Week) had a strong move, with some gains reaching 9%. While some stocks surged, others are still … [Read more...]
Money Wave Alert! Mar 18, 2025
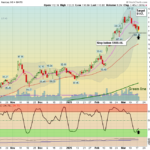
March 18, 2025 Today the Nasdaq Gapped Down slightly on bad news, but the Volume was low (Bullish). If this is a Wave 2 decline with a higher low than Thursday, we could see a larger Wave 3 up later this week. FED meeting tomorrow, but FED will … [Read more...]
- « Previous Page
- 1
- …
- 52
- 53
- 54
- 55
- 56
- …
- 490
- Next Page »