
Above the Green Line presents both daily and weekly posts to its members highlighting Investment News and Trade alerts.
Money Wave Alert! Apr 29, 2025
April 29, 2025.Today, the Nasdaq saw a strong move to the upside, with SPY meeting the Banana Line on the 1-hour chart—a key sign of recovery after recent dips. The VIX (fear index) is cooling off, reverting back toward its mean, which is generally … [Read more...]
Money Wave Alert! Apr 28, 2025
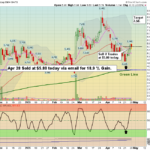
TOP PICK OF THE WEEK: IamGold Corp, $IAG was bought on the open today, and will be Sold on the Close Friday. April 28, 2025. Markets opened today with weak strength, and SPY struggled to gain any solid upside momentum. Inverse funds and the Fear … [Read more...]
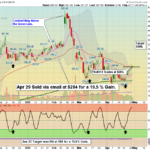
Money Wave Alert! Apr 25, 2025

TOP PICK OF THE WEEK: DOXIMITY CORP, $DOCS, will be Sold on the Close today for a nice Gain. April 25, 2025. Markets were mostly higher today, pushing higher toward its mean value. Gold and gold miners dipped again but are poised to rally back … [Read more...]
Money Wave Alert! Apr 24, 2025

April 24, 2025.Today’s Nasdaq was firmly bullish, pushing higher toward its mean value and climbing again. Gold and gold miners dipped today but are poised to rally back soon, potentially forming an M-pattern or double top as gold remains the … [Read more...]
Money Wave Alert! Apr 23, 2025

April 23, 2025.The Nasdaq has shown a robust bullish surge today , driving prices higher and confirming a successful higher low that signals strength in the uptrend. Despite this positive momentum—often referred to as a “retrace back to the banana … [Read more...]
- « Previous Page
- 1
- …
- 47
- 48
- 49
- 50
- 51
- …
- 490
- Next Page »