
Above the Green Line presents both daily and weekly posts to its members highlighting Investment News and Trade alerts.
Money Wave Alert! May 6, 2025
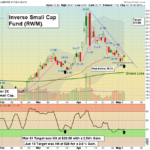
May 6, 2025 Today the Nasdaq opened with bearish momentum as fear levels rose again. Inverse funds like SH and RWM gained after a brief pullback, showing potential for a strong upside wave. This signals caution before buying into leading stocks. Gold … [Read more...]
Money Wave Alert! May 5, 2025
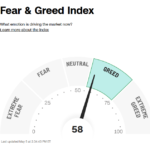
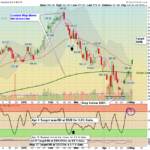
The Top Pick of the Week: IAMGOLD CORP $IAG was bought on the Open today for new members, Sell on the Close Friday. The Gold Miners should try the recent highs soon. May 5, 2025 Today the Nasdaq showed weak momentum, after FEAR has bounced up … [Read more...]
Money Wave Alert! May 2, 2025
The Top Pick of the Week: IAMGOLD CORP $IAG was down this week, So we will not Sell it until the Close next Friday. The Gold Miners should try the recent s highs soon. May 2, 2025 Today the Nasdaq showed Gentle upside momentum, signaling a … [Read more...]
Money Wave Alert! May 1, 2025
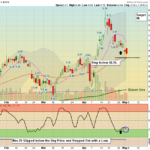
May 1, 2025 Today the Nasdaq saw a positive move, with overall markets including SPY, trending higher. Despite the upward momentum, SPY’s volume remained below average, suggesting a potential pause or shift ahead. Gold declined amid increased market … [Read more...]
Money Wave Alert! Apr 30, 2025
April 30, 2025 The NASDAQ opened with a gap down alongside the SPY as trade war tensions continue to weigh on the markets. We identified early strength building in inverse funds, but still no swing trade Buy Signals yet. The VIX (Fear index) also … [Read more...]
- « Previous Page
- 1
- …
- 46
- 47
- 48
- 49
- 50
- …
- 490
- Next Page »