
Above the Green Line presents both daily and weekly posts to its members highlighting Investment News and Trade alerts.
Money Wave Alert! May 27, 2025
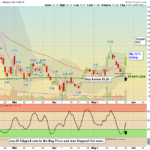
The Top Pick of the Week: Archer Aviation $ACHR was bought on the Open today, and will be sold on the Close Friday May 27, 2025 Today, the Nasdaq Gapped Up on Good News (Panic Buying) as the S&P500 Fund was back down in the Green Zone … [Read more...]
Simple Investment System after a 15 year Bull Mkt.
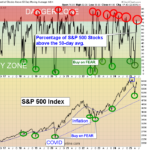
How to make Money in a tired Stock Market. The S&P 500 Index has had an incredible upward move since the 2009 Recession. This move up is historic in length and time (15 years). So far the S&P has made no Gains this year, as Stocks are … [Read more...]
Money Wave Alert! May 23, 2025
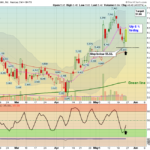
Markets will be Closed on Monday for Memorial Day Holiday. The Top Pick of the Week: Gold Fund $IAG will be sold on the Close today for a nice weekly Gain. May 23, 2025 Today, the Nasdaq opened lower amid negative market sentiment, triggered … [Read more...]
Money Wave Alert! May 22, 2025
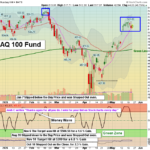
May 22, 2025 The Nasdaq opened higher today as the weak Bonds firmed up. The SPY ETF mirrored this sentiment, exhibiting mild buying after yesterday's weakness. Bonds are dumping to tell Congress to pass a Responsible Spending Bill. Bitcoin is … [Read more...]
Money Wave Alert! May 21, 2025

May 21, 2025 the Nasdaq opened with a slight dip before dropping down more on weak Bonds. The SPY ETF mirrored this sentiment, exhibiting overall weakness and lacking clear bullish momentum. Bonds are dumping to tell Congress to pass a … [Read more...]
- « Previous Page
- 1
- …
- 43
- 44
- 45
- 46
- 47
- …
- 490
- Next Page »