
Above the Green Line presents both daily and weekly posts to its members highlighting Investment News and Trade alerts.
Money Wave Alert! Feb 10, 2021
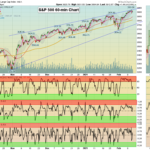
Markets were mixed again today after dumping lower in the morning. The rally up since bouncing off the Red Lines (50-day avg.) last week is getting tired. But there are still Buyers that need to spend ALL of their Money up here. Most of the … [Read more...]
Money Wave Alert! Feb 9, 2021
Markets were mixed today as the Indices were able to make Higher Highs, but are over-bought and back up into the Red Zones (probably too late to Buy for the Short Term). Remember this type of rally that the Market is in: up day after day with "Story … [Read more...]
Money Wave Alert! Feb 8, 2021
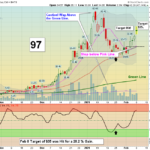
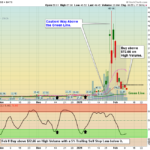
Markets were higher again today as Buying continued on Low Volume. The Indices were able to make Higher Highs, and nobody wants to Sell from FOMO (Fear Of MISSING OUT). Several more Targets were Hit today and most of the Leaders are now back up into … [Read more...]
Money Wave Alert! Feb 5, 2021
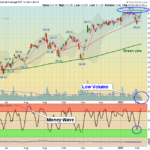
Markets were slightly higher today as the Indices were able to make Higher Highs, but it is more Bullish if the Volume is High, not Low like today... The bounces up from the Green Zones this time are extremely weak, indicating a lack of Buyers.. … [Read more...]
Money Wave Alert! Feb 4, 2021
Sorry, the Charts are not loading well today from StockCharts. Markets were higher today as the Indices need to make Higher Highs soon for this rally to continue. The Small Cap Fund (IWM) was the only major Index to make higher highs today. The … [Read more...]
- « Previous Page
- 1
- …
- 256
- 257
- 258
- 259
- 260
- …
- 484
- Next Page »