
Above the Green Line presents both daily and weekly posts to its members highlighting Investment News and Trade alerts.
Money Wave Alert! Mar 11, 2021
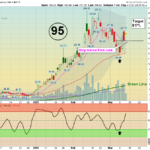
SORRY, SERVER PROBLEMS TODAY. Markets were higher today as more Stimulus Checks could go out this weekend to Americans. The DOW 30 Index made New Highs today. The Momentum Leaders that got hit have popped up nicely, and many Indices are back up in … [Read more...]
Money Wave Alert! Mar 10, 2021
Markets were higher today as the Congress approved another $1.9 Trillion of Stimulus Spending Money that we do not have. Momentum Stocks were higher in the morning and then some profit taking came in from yesterday's gains. The Momentum Leaders that … [Read more...]
Money Wave Alert! Mar 9, 2021
Markets were higher today as the Momentum Stocks finally popped up on Money Wave Buy Signals & Short Covering. Many were up 10 -20 % today, and now need to get above the Pink Lines (10-day avgs.) to go higher. The Momentum Leaders should pop at … [Read more...]
Money Wave Alert! Mar 8, 2021
Markets were mostly higher today but some Big Tech and Momentum Stocks continued lower. Many newer Investors did not realize how High the Momentum Stocks had become, and are now panic selling the Leaders after they have dropped 30 - 60 % from the … [Read more...]
Money Wave Alert! Mar 5, 2021
Markets were lower this morning but some Buying finally came in after lunch. Big Tech and Momentum Stocks have dropped hard this week as beginner investors bought Way Above the Green Line recently, and then got Flushed. Tesla lost $350 BILLION of … [Read more...]
- « Previous Page
- 1
- …
- 252
- 253
- 254
- 255
- 256
- …
- 484
- Next Page »