
Above the Green Line presents both daily and weekly posts to its members highlighting Investment News and Trade alerts.
Money Wave Alert! Aug 23, 2021
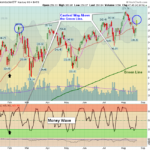
Markets were higher again today as the S&P 500 and NASDAQ 100 Indices were able to make New Highs. The DOW 30 Index and the Small Caps are lagging. Volume is low on most, so we are not wanting to Buy much at the Highs. Low Volume normally means … [Read more...]
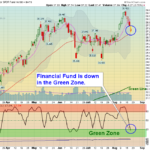
Money Wave Alert! Aug 20, 2021

Markets were higher today after the Indices dropped down near the Red Lines (50-day avgs.) and bounced. But the bounces are the same as they have been for months: with poor Buying Volume. Smart Money is not Buying much with the Markets near Highs... … [Read more...]
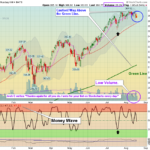
Money Wave Alert! Aug 19, 2021
Markets were mixed today after dumping down to lower Lows this morning. More Investor FEAR is increasing from expected negative News from the Main Stream Media. The Tech Stocks were higher. Several Leading Investments are slowly returning to the … [Read more...]
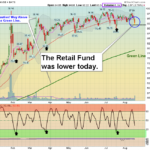
Money Wave Alert! Aug 18, 2021
Markets were lower again today as Investor FEAR is starting to increase from expected negative News from the Main Stream Media. The DOW 30 and S&P 500 Indices were very over-bought and were up in the Red Zones (probably too late to Buy for the … [Read more...]
Money Wave Alert! Aug 17, 2021
Markets were lower today as the DOW 30 and S&P 500 Indices were very over-bought and were back up in the Red Zones (probably too late to Buy for the Short Term). After today's decline, the Indices are trying to hold above the Pink Lines (10-day … [Read more...]
- « Previous Page
- 1
- …
- 229
- 230
- 231
- 232
- 233
- …
- 483
- Next Page »