
Above the Green Line presents both daily and weekly posts to its members highlighting Investment News and Trade alerts.
Money Wave Alert! Jan 25, 2022
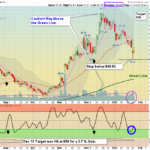
Markets were mixed today after dumping down again this morning, but the Indices made Higher Lows than yesterday. That is normally Bullish, and we might be finished with the "Selling Climax" for a while. Normally the Indices that made fresh New … [Read more...]
Money Wave Alert! Jan 24, 2022
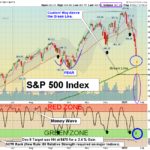
Markets were lower today as the S&P 500 Index dumped down Below the Green Line in the morning, and then bounced. Volume was huge as the Herd sold on bad news. This is called a "Selling Climax", were we like to Buy soon. Normally the Indices … [Read more...]
Money Wave Alert! Jan 21, 2022
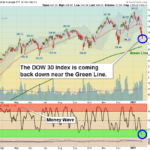
Markets were lower today as the S&P 500 Index could not hold above of Support of 4495 yesterday. Next support is now the Green Line around 4312. Normally the Indices that made fresh New Highs recently like the S&P 500 and DOW 30 Indices will … [Read more...]
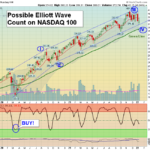
Money Wave Alert! Jan 20, 2022
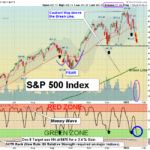
Markets rallied in the morning, but then Sellers came in. The Indices have not been able to bounce up off last Monday's Lows. So far the decline is a very slow and orderly Correction. The NASDAQ 100 is already down 11.5% from the Highs. The … [Read more...]
Money Wave Alert! Jan 19, 2022
Markets were down again today as the Indices have not been able to bounce up off last Monday's Lows. So far the decline is a very slow and orderly Correction. The NASDAQ 100 Fund is quickly down in the Green Zone (probably too late to Sell for the … [Read more...]
- « Previous Page
- 1
- …
- 207
- 208
- 209
- 210
- 211
- …
- 483
- Next Page »